

Description
The Thermoplastic Elastomers (TPE) Market Report is now also available in parts (e.g. individual country profiles or all manufacturer profiles). Please feel free to contact us and we will immediately send you an offer for your specific selection.
Soft and flexible, yet easy and inexpensive to process: Thermoplastic elastomers (TPE) are elastic like rubber at room temperature, but can be melted and repeatedly moulded like standard plastics. TPEs offer high strength and are robust; they can be welded watertight and colored in a variety of ways. In principle, TPEs can also be recycled. These innovative materials, which combine the advantages of two material groups, are conquering more and more areas of application. Furthermore, TPEs are interesting because components can be made from renewable raw materials or combined with bioplastics. Ceresana has analyzed the global market for thermoplastic elastomers for the fourth time: By 2031, revenues generated with TPEs are expected to rise to almost USD 27 billion. However, growth will be driven not only by increasing demand, but also by price inflation.
TPE Applications from Shoe Soles to Bumpers
Because of their versatile properties, TPEs are used in a wide variety of applications. Their good abrasion resistance makes them a suitable material for shoe soles and for soft-touch handles, such as those of toothbrushes, bicycle handlebars or tools. Since TPEs do not require plasticizers due to their high elastomer content, they can be processed into hoses for the pharmaceutical, medical and food industries as an alternative to PVC. Nevertheless, the main customer for TPE manufacturers is the automotive industry: worldwide, around 33% of all TPE products are used in this industry. Applications range from fabric coatings, seals, cable sheathing and insert mats to covers for airbags and bumpers. TPEs are also increasingly being used by other industries, such as mechanical engineering, electrical engineering and electronics, and the sports and toy industries. The construction industry, uses roof membranes made of TPE.
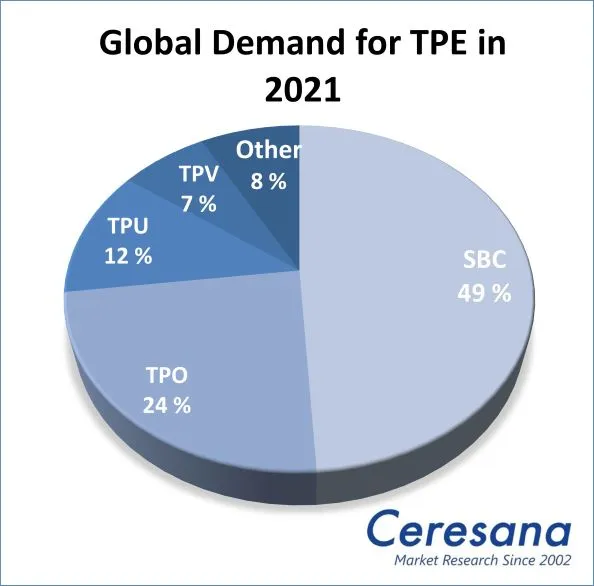
Expanding Market for SBC and Other TPE Grades
The production of thermoplastic elastomers is dominated by manufacturers in Asia: it accounts for roughly two thirds of global TPE production, followed by North America and Western Europe. The market shares of the various TPE grades vary greatly and depend above all on the different developments in the respective user industries. By far the most widely used TPE grade is styrenic block copolymers (TPS, TPE-S or SBC), which account for around 49% of global demand. Their use ranges from blending in adhesives to asphalt modification in road construction. Thermoplastic polyolefins (TPO), which are mainly used in the automotive industry, come in second. Another important type of TPE is thermoplastic polyurethane (TPU), which is used for dashboards and housing shells, for example.
The Study in Brief:
Chapter 1 provides a differentiated presentation and analysis of the global TPE market – including forecasts up to 2031: the development of revenues, demand and production is detailed for each region of the world.
The following TPE types are considered individually:
- Styrenic Block Copolymers (TPS, SBC and others)
- Thermoplastic Polyolefins (TPO)
- Thermoplastic Polyurethanes (TPU)
- Thermoplastic Vulcanizates (TPV)
- Other Thermoplastic Elastomers.
It also covers the various applications of thermoplastic elastomers:
- Vehicles
- Construction Industry
- Other Industries
- Footwear and Sporting Goods
- Household Appliances and Other Consumer Goods.
Chapter 2 provides a detailed analysis of the 16 most important countries for the TPE market in regards to demand, exports, import, production and revenues. In addition, the countries are considered in terms of application areas. The market data on demand volumes per country are broken down for the individual product types.
Chapter 3 provides a useful manufacturer directory of the 53 most important producers of TPE. The individual company profiles are clearly arranged by contact details, sales, profits, product range, production sites and profile summary. The largest TPE producers include, China Petroleum & Chemical Corp. (Sinopec Corp.), Celanese Corp., Versalis S.p.A., BASF SE, Dynasol Group, Arkema S.A., LyondellBasell Industries, Mitsubishi Chemical Corporation, and Sumitomo Chemical Co., Ltd.
Scope of the Report:
Attributes | Details |
| Base Year | 2021 |
| Trend Period | 2019 – 2031 |
| Forecast Period | 2022 – 2031 |
| Pages | 260 |
| Product Type | Styrene Block Copolymers (SBC), Thermoplastic Polyolefins (TPO), Thermoplastic Polyurethanes (TPU), Thermoplastic Vulcanizates (TPV), Other Thermoplastic Elastomers |
| Application Areas | Transportation, Construction, Other Industries, Shoes and Sporting Goods, Other Consumer Goods |
| Company Profiles | BASF SE, Celanese Corp., Dynasol Group, Arkema S.A., LyondellBasell Industries, Mitsubishi Chemical Corporation, and Sumitomo Chemical Co., Ltd (Selection) |
| Edition | 4th edition |
| Publication | November 2022 |
FAQs
How high will the revenues generated with TPE be in 2031?
Global revenues generated with thermoplastic elastomers are expected to increase to almost USD 27 billion by 2031.
What is the most important area of application for TPE?
The main customer of TPE is the automotive industry: worldwide, around 33% of all TPE products are used in this industry.
Which TPE type has the highest market share?
By far the most widely used TPE grade is styrenic block copolymers (TPS, TPE-S or SBC), which account for around 49% of global demand.
1 Market Data: World and Regions
1.1 World
1.1.1 Demand
1.1.2 Revenues
1.1.3 Production
1.1.4 Demand Split by Application Areas
1.1.4.1 Transportation
1.1.4.2 Construction Industry
1.1.4.3 Other Industries
1.1.4.4 Shoes and Sporting Goods
1.1.4.5 Consumer Goods
1.1.5 Demand Split by Products
1.1.5.1 Styrene Block Copolymers (SBC)
1.1.5.2 Thermoplastic Polyolefins (TPO)
1.1.5.3 Thermoplastic Polyurethanes (TPU)
1.1.5.4 Thermoplastic Vulcanizates (TPV)
1.1.5.5 Other Thermoplastic Elastomers
1.2 Western Europe
1.2.1 Demand
1.2.2 Revenues
1.2.3 Production
1.2.4 Applications & Products
1.3 Eastern Europe
1.3.1 Demand
1.3.2 Revenues
1.3.3 Production
1.3.4 Applications & Products
1.4 North America
1.4.1 Demand
1.4.2 Revenues
1.4.3 Production
1.4.4 Applications & Products
1.5 South America
1.5.1 Demand
1.5.2 Revenues
1.5.3 Production
1.5.4 Applications & Products
1.6 Asia-Pacific
1.6.1 Demand
1.6.2 Revenues
1.6.3 Production
1.6.4 Applications & Products
1.7 Middle East / Africa
1.7.1 Demand
1.7.2 Revenues
1.7.3 Production
1.7.4 Applications & Products
2 Market Data: Country Profiles
(For each country: Revenues, demand split by applications & by types as well as production, import & export)
2.1 Western Europe
2.1.1 France
2.1.2 Germany
2.1.3 Italy
2.1.4 Spain
2.1.5 United Kingdom
2.1.6 Other Western Europe
2.2 Eastern Europe
2.2.1 Poland
2.2.2 Russia
2.2.3 Turkey
2.2.4 Other Eastern Europe
2.3 North America
2.3.1 Canada
2.3.2 Mexico
2.3.3 USA
2.4 South America
2.4.1 Brazil
2.4.2 Other South America
2.5 Asia-Pacific
2.5.1 China
2.5.2 India
2.5.3 Japan
2.5.4 South Korea
2.5.5 Other Asia-Pacific
3 Company Profiles*
3.1 Western Europe
France (1 Producer)
Germany (4)
Italy (3)
Spain (1)
The Netherlands (3)
3.2 Eastern Europe
Russia (2)
Turkey (2)
3.3 North America
USA (7)
3.4 Asia-Pacific
China (9)
India (1)
Japan (10)
South Korea (6)
Taiwan (4)
*Note: The profiles are assigned to the country in which the company or holding is headquartered. Profiles also include JVs and subsidiaries.
Graph 1: Global demand from 2019 to 2031
Graph 2: Global demand from 2019 to 2031 – split by regions
Graph 3: Global revenues from 2019 to 2031 in million USD and million EUR
Graph 4: Global revenues from 2019 to 2031 in million USD – split by regions
Graph 5: Global revenues from 2019 to 2031 in million EUR – split by regions
Graph 6: Global production from 2019 to 2031
Graph 7: Global production from 2019 to 2031 – split by regions
Graph 8: Global demand from 2019 to 2031 – split by applications
Graph 9: Global demand in the segment transportation from 2019 to 2031 – split by regions
Graph 10: Global demand in the segment construction from 2019 to 2031 – split by regions
Graph 11: Global demand in other industries from 2019 to 2031 – split by regions
Graph 12: Global demand in the segment shoes and sporting goods from 2019 to 2031 – split by regions
Graph 13: Global demand in the segment consumer goods from 2019 to 2031 – split by regions
Graph 14: Global demand from 2019 to 2031 – split by products
Graph 15: Global demand for SBC from 2019 to 2031 – split by regions
Graph 16: Global demand for TPO from 2019 to 2031 – split by regions
Graph 17: Global demand for TPU from 2019 to 2031 – split by regions
Graph 18: Global demand for TPV from 2019 to 2031 – split by regions
Graph 19: Global demand for other thermoplastic elastomers from 2019 to 2031 – split by regions
Graph 20: Demand in Western Europe from 2019 to 2031
Graph 21: Revenues generated in Western Europe from 2019 to 2031, in million USD and million EUR
Graph 22: Production in Western Europe from 2019 to 2031
Graph 23: Demand in Western Europe from 2019 to 2031 – split by applications
Graph 24: Demand in Eastern Europe from 2019 to 2031
Graph 25: Revenues in Eastern Europe from 2019 to 2031, in million USD and million EUR
Graph 26: Production in Eastern Europe from 2019 to 2031
Graph 27: Demand in Eastern Europe from 2019 to 2031 – split by applications
Graph 28: Demand in North America from 2019 to 2031
Graph 29: Revenues generated in North America from 2019 to 2031, in million USD and million EUR
Graph 30: Production in North America from 2019 to 2031
Graph 31: Demand in North America from 2019 to 2031 – split by applications
Graph 32: Demand in South America from 2019 to 2031
Graph 33: Revenues in South America from 2019 to 2031, in million USD and million EUR
Graph 34: Production in South America from 2019 to 2031
Graph 35: Demand in South America from 2019 to 2031 – split by applications
Graph 36: Demand in Asia-Pacific from 2019 to 2031
Graph 37: Revenues generated in Asia-Pacific from 2019 to 2031, in million USD and million EUR
Graph 38: Production in Asia-Pacific from 2019 to 2031
Graph 39: Demand in Asia-Pacific from 2019 to 2031 – split by applications
Graph 40: Demand in the Middle East / Africa from 2019 to 2031
Graph 41: Revenues in the Middle East / Africa from 2019 to 2031, in million USD and million EUR
Graph 42: Production in the Middle East / Africa from 2019 to 2031
Graph 43: Demand in the Middle East / Africa from 2019 to 2031 – split by applications
Graph 44: Demand in France from 2019 to 2031
Graph 45: Production in France from 2019 to 2031
Graph 46: Demand in Germany from 2019 to 2031
Graph 47: Production in Germany from 2019 to 2031
Graph 48: Demand in Italy from 2019 to 2031
Graph 49: Production in Italy from 2019 to 2031
Graph 50: Demand in Spain from 2019 to 2031
Graph 51: Production in Spain from 2019 to 2031
Graph 52: Demand in the United Kingdom from 2019 to 2031
Graph 53: Production in the United Kingdom from 2019 to 2031
Graph 54: Demand in Other Western Europe from 2019 to 2031
Graph 55: Production in Other Western Europe from 2019 to 2031
Graph 56: Demand in Poland from 2019 to 2031
Graph 57: Production in Poland from 2019 to 2031
Graph 58: Demand in Russia from 2019 to 2031
Graph 59: Production in Russia from 2019 to 2031
Graph 60: Demand in Turkey from 2019 to 2031
Graph 61: Production in Turkey from 2019 to 2031
Graph 62: Demand in Other Eastern Europe from 2019 to 2031
Graph 63: Production in Other Eastern Europe from 2019 to 2031
Graph 64: Demand in Canada from 2019 to 2031
Graph 65: Production in Canada from 2019 to 2031
Graph 66: Demand in Mexico from 2019 to 2031
Graph 67: Production in Mexico from 2019 to 2031
Graph 68: Demand in the USA from 2019 to 2031
Graph 69: Production in the USA from 2019 to 2031
Graph 70: Demand in Brazil from 2019 to 2031
Graph 71: Production in Brazil from 2019 to 2031
Graph 72: Demand in Other South America from 2019 to 2031
Graph 73: Production in Other South America from 2019 to 2031
Graph 74: Demand in China from 2019 to 2031
Graph 75: Production in China from 2019 to 2031
Graph 76: Demand in India from 2019 to 2031
Graph 77: Production in India from 2019 to 2031
Graph 78: Demand in Japan from 2019 to 2031
Graph 79: Production in Japan from 2019 to 2031
Graph 80: Demand in South Korea from 2019 to 2031
Graph 81: Production in South Korea from 2019 to 2031
Graph 82: Demand in the remaining countries of Asia-Pacific from 2019 to 2031
Graph 83: Production in Other Asia-Pacific from 2019 to 2031
Table 1: Global demand from 2019 to 2031 – split by regions
Table 2: Global revenues from 2019 to 2031 in million USD – split by regions
Table 3: Global revenues from 2019 to 2031 in million EUR – split by regions
Table 4: Global production from 2019 to 2031 – split by regions
Table 5: Global demand from 2019 to 2031 – split by applications
Table 6: Global demand in the segment transportation from 2019 to 2031 – split by regions
Table 7: Global demand in the segment construction from 2019 to 2031 – split by regions
Table 8: Global demand in other industries from 2019 to 2031 – split by regions
Table 9: Global demand in the segment shoes and sporting goods from 2019 to 2031 – split by regions
Table 10: Global demand in the segment consumer goods from 2019 to 2031 – split by regions
Table 11: Global demand from 2019 to 2031 – split by products
Table 12: Global demand for SBC from 2019 to 2031 – split by regions
Table 13: Global demand for TPO from 2019 to 2031 – split by regions
Table 14: Global demand for TPU from 2019 to 2031 – split by regions
Table 15: Global demand for TPV from 2019 to 2031 – split by regions
Table 16: Global demand for other thermoplastic elastomers from 2019 to 2031 – split by regions
Table 17: Demand in Western Europe from 2019 to 2031 – split by major countries
Table 18: Revenues generated in Western Europe from 2019 to 2031, in million USD and million EUR
Table 19: Production in Western Europe from 2019 to 2031 – split by major countries
Table 20: Demand in Western Europe from 2019 to 2031 – split by applications
Table 21: Demand in Western Europe from 2019 to 2031 – split by products
Table 22: Demand in Eastern Europe from 2019 to 2031 – split by major countries
Table 23: Revenues in Eastern Europe from 2019 to 2031, in million USD and million EUR
Table 24: Production in Eastern Europe from 2019 to 2031 – split by major countries
Table 25: Demand in Eastern Europe from 2019 to 2031 – split by applications
Table 26: Demand in Eastern Europe from 2019 to 2031 – split by products
Table 27: Demand in North America from 2019 to 2031 – split by major countries
Table 28: Revenues generated in North America from 2019 to 2031, in million USD and million EUR
Table 29: Production in North America from 2019 to 2031 – split by major countries
Table 30: Demand in North America from 2019 to 2031 – split by applications
Table 31: Demand in North America from 2019 to 2031 – split by products
Table 32: Demand in South America from 2019 to 2031 – split by major countries
Table 33: Revenues in South America from 2019 to 2031, in million USD and million EUR
Table 34: Production in South America from 2019 to 2031 – split by major countries
Table 35: Demand in South America from 2019 to 2031 – split by applications
Table 36: Demand in South America from 2019 to 2031 – split by products
Table 37: Demand in Asia-Pacific from 2019 to 2031 – split by major countries
Table 38: Revenues generated in Asia-Pacific from 2019 to 2031, in million USD and million EUR
Table 39: Production in Asia-Pacific from 2019 to 2031 – split by major countries
Table 40: Demand in Asia-Pacific from 2019 to 2031 – split by applications
Table 41: Demand in Asia-Pacific from 2019 to 2031 – split by products
Table 42: Revenues in the Middle East / Africa from 2019 to 2031, in million USD and million EUR
Table 43: Demand in the Middle East / Africa from 2019 to 2031 – split by applications
Table 44: Demand in the Middle East / Africa from 2019 to 2031 – split by products
Table 45: Revenues generated in France from 2019 to 2031, in million USD and million EUR
Table 46: Demand in France from 2019 to 2031 – split by applications
Table 47: Demand in France from 2019 to 2031 – split by products
Table 48: Production, import, export and demand in France from 2019 to 2031
Table 49: Revenues generated in Germany from 2019 to 2031, in million USD and million EUR
Table 50: Demand in Germany from 2019 to 2031 – split by applications
Table 51: Demand in Germany from 2019 to 2031 – split by products
Table 52: Production, import, export and demand in Germany from 2019 to 2031
Table 53: Revenues generated in Italy from 2019 to 2031, in million USD and million EUR
Table 54: Demand in Italy from 2019 to 2031 – split by applications
Table 55: Demand in Italy from 2019 to 2031 – split by products
Table 56: Production, import, export and demand in Italy from 2019 to 2031
Table 57: Revenues generated in Spain from 2019 to 2031, in million USD and million EUR
Table 58: Demand in Spain from 2019 to 2031 – split by applications
Table 59: Demand in Spain from 2019 to 2031 – split by products
Table 60: Production, import, export and demand in Spain from 2019 to 2031
Table 61: Revenues generated in the United Kingdom from 2019 to 2031, in million USD and million EUR
Table 62: Demand in the United Kingdom from 2019 to 2031 – split by applications
Table 63: Demand in the United Kingdom from 2019 to 2031 – split by products
Table 64: Production, import, export and demand in the United Kingdom from 2019 to 2031
Table 65: Revenues in Other Western Europe from 2019 to 2031, in million USD and million EUR
Table 66: Demand in Other Western Europe from 2019 to 2031 – split by applications
Table 67: Demand in Other Western Europe from 2019 to 2031 – split by products
Table 68: Production, import, export and demand in the remaining countries of Western Europe from 2019 to 2031
Table 69: Revenues generated in Poland from 2019 to 2031, in million USD and million EUR
Table 70: Demand in Poland from 2019 to 2031 – split by applications
Table 71: Demand in Poland from 2019 to 2031 – split by products
Table 72: Production, import, export and demand in Poland from 2019 to 2031
Table 73: Revenues generated in Russia from 2019 to 2031, in million USD and million EUR
Table 74: Demand in Russia from 2019 to 2031 – split by applications
Table 75: Demand in Russia from 2019 to 2031 – split by products
Table 76: Production, import, export and demand in Russia from 2019 to 2031
Table 77: Revenues generated in Turkey from 2019 to 2031, in million USD and million EUR
Table 78: Demand in Turkey from 2019 to 2031 – split by applications
Table 79: Demand in Turkey from 2019 to 2031 – split by products
Table 80: Production, import, export and demand in Turkey from 2019 to 2031
Table 81: Revenues generated in Other Eastern Europe from 2019 to 2031, in million USD and million EUR
Table 82: Demand in Other Eastern Europe from 2019 to 2031 – split by applications
Table 83: Demand in Other Eastern Europe from 2019 to 2031 – split by products
Table 84: Production, import, export and demand in the remaining countries of Eastern Europe from 2019 to 2031
Table 85: Revenues in Canada from 2019 to 2031, in million USD and million EUR
Table 86: Demand in Canada from 2019 to 2031 – split by applications
Table 87: Demand in Canada from 2019 to 2031 – split by products
Table 88: Production, import, export and demand in Canada from 2019 to 2031
Table 89: Revenues in Mexico from 2019 to 2031, in million USD and million EUR
Table 90: Demand in Mexico from 2019 to 2031 – split by applications
Table 91: Demand in Mexico from 2019 to 2031 — split by products
Table 92: Production, import, export and demand in Mexico from 2019 to 2031
Table 93: Revenues generated in the USA from 2019 to 2031, in million USD and million EUR
Table 94: Demand in the USA from 2019 to 2031 – split by applications
Table 95: Demand in the USA from 2019 to 2031 – split by products
Table 96: Production, import, export and demand in the USA from 2019 to 2031
Table 97: Revenues generated in Brazil from 2019 to 2031, in million USD and million EUR
Table 98: Demand in Brazil from 2019 to 2031 – split by applications
Table 99: Demand in Brazil from 2019 to 2031 – split by products
Table 100: Production, import, export and demand in Brazil from 2019 to 2031
Table 101: Revenues in Other South America from 2019 to 2031, in million USD and million EUR
Table 102: Demand in Other South America from 2019 to 2031 – split by applications
Table 103: Demand in Other South America from 2019 to 2031 – split by products
Table 104: Production, import, export and demand in the remaining countries of South America from 2019 to 2031
Table 105: Revenues generated in China from 2019 to 2031, in million USD and million EUR
Table 106: Demand in China from 2019 to 2031 – split by applications
Table 107: Demand in China from 2019 to 2031 – split by products
Table 108: Production, import, export and demand in China from 2019 to 2031
Table 109: Revenues generated in India from 2019 to 2031, in million USD and million EUR
Table 110: Demand in India from 2019 to 2031 – split by applications
Table 111: Demand in India from 2019 to 2031 — split by products
Table 112: Production, import, export and demand in India from 2019 to 2031
Table 113: Revenues in Japan from 2019 to 2031, in million USD and million EUR
Table 114: Demand in Japan from 2019 to 2031 – split by applications
Table 115: Demand in Japan from 2019 to 2031 – split by products
Table 116: Production, import, export and demand in Japan from 2019 to 2031
Table 117: Revenues generated in South Korea from 2019 to 2031, in million USD and million EUR
Table 118: Demand in South Korea from 2019 to 2031 – split by applications
Table 119: Demand in South Korea from 2019 to 2031 – split by products
Table 120: Production, import, export and demand in South Korea from 2019 to 2031
Table 121: Revenues in the remaining countries of Asia-Pacific from 2019 to 2031, in million USD and million EUR
Table 122: Demand in the remaining countries of Asia-Pacific from 2019 to 2031 – split by applications
Table 123: Demand in the remaining countries of Asia-Pacific from 2019 to 2031 – split by products
Table 124: Production, import, export and demand in the remaining countries of Asia-Pacific from 2019 to 2031


