

Description
The Synthetic Rubber Market Report is now also available in parts (e.g. individual country profiles or all manufacturer profiles). Please feel free to contact us and we will immediately send you an offer for your specific selection.
Synthetic elastomers are malleable like natural rubber made from latex, but at the same time they are more heat-resistant, more resistant to chemicals and don’t depend on crops or climate: synthetic rubber is indispensable for numerous everyday products and technical applications. This is the fourth time that Ceresana has analyzed the global market for these elastic plastics in detail. A total of over 11.8 million tonnes are consumed each year. The latest study provides comprehensive data since 2018 and forecasts up to 2030. All information on demand, production, imports and exports is given in tonnes, while revenues are given in both USD and EUR.
Main Application: Vehicle Tires
The most important area of application for synthetic elastomers is tires for all types of vehicles: around 54% of total global demand is attributable to original and replacement tires. However, elastic materials are also needed for numerous other products in the automotive industry: Hoses, cables, seals, window and door profiles, but also for engine mounts or bellows for shock absorbers. Ceresana analysts expect global demand for synthetic elastomers in the automotive industry to increase by 2.6% p.a. until 2030.
Technical Rubber Products
The second largest area of application for synthetic elastomers is in dimensionally stable but elastically malleable technical products, such as conveyor belts, roller coverings, molded parts and roof sheeting. There is increasing demand for rubber products from the chemical industry, mechanical engineering, the construction industry and the electrical and electronics industry. Synthetic rubber is also used to modify materials, i.e., as an admixture to other materials. Ceresana forecasts that global demand for elastic plastics in the industrial and construction sectors will increase by 2.4% per year until 2030.
Various Grades of Synthetic Elastomers
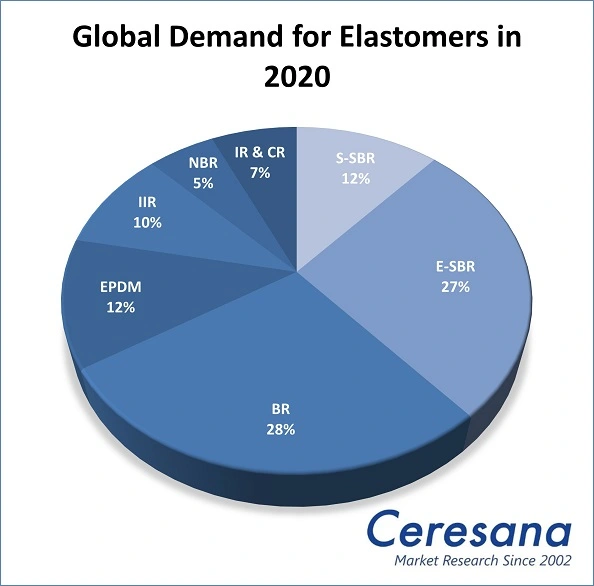
Synthetic elastomers are manufactured from raw petrochemical materials, primarily styrene and butadiene. Styrene-butadiene rubber (SBR) is by far the most important grade at the moment, with around 5.1 million tonnes consumed in 2020. SBR is produced by emulsion polymerization (E-SBR) or by solution polymerization (S-SBR). E-SBR currently accounts for about 62% of total SBR demand. However, the demand for S-SBR is developing more dynamically, with growth rates of 3.0% per year. The tire industry is the most important market for SBR, as well as for butadiene rubber (BR), butyl rubber (IIR) and polyisoprene (IR). Other elastomer grades, on the other hand, are used primarily for industrial and construction products and for the modification of materials: e.g., ethylene-propylene-diene rubber (EPDM), chlorobutadiene (CR) and acrylonitrile-butadiene rubber (NBR).
Current Market Data on Synthetic Rubber
Chapter 1 provides a depiction and analysis of the world market for synthetic elastomers – including forecasts up to 2030: the development of revenues, demand and production is detailed for each world region. In addition, the various areas of application for synthetic rubber are analyzed: Data and factors influencing use in:
- Tires
- Vehicles
- Industrial and construction products
- Modification of materials
- Other uses
The demand is also considered in detail – split up into the types:
- Styrene-butadiene rubber (E-SBR)
- Styrene-butadiene rubber (S-SBR)
- Butadiene rubber (BR)
- Ethylene-propylene-diene rubber (EPDM)
- Butyl rubber (IIR)
- Acrylonitrile-butadiene rubber (NBR)
- Chlorobutadiene (CR) & polyisoprene (IR)
Chapter 2 provides a detailed analysis of 25 countries:
- Demand
- Export & Import
- Production
- Revenues
In addition, the different areas of application are considered. The market data of demand per country is broken down for the individual elastomer types.
Chapter 3 provides a useful manufacturer directory with the 66 most important elastomer producers, clearly structured by contact details, revenue, profit, product range, production facilities, brief profile and capacity details. The most important manufacturers include: ARLANXEO Holding B.V., Bridgestone Corporation, ExxonMobil Chemical Company, Goodyear Tire & Rubber Company, JSR Corporation, Korea Kumho Petrochemical Co., Ltd. (KKPC), Lanxess AG, Nizhnekamskneftekhim JSC (NKNK), PetroChina Company Limited (CNPC), Synthos S.A., and Versalis S.p.A.
Scope of the Report:
Attributes | Details |
| Base Year | 2020 |
| Trend Period | 2018 – 2030 |
| Forecast Period | 2021 – 2030 |
| Pages | 320 |
| Application Areas | Tires, Vehicles, Industrial and Construction Products, Modification of Materials and Other Uses |
| Product Type | Styrene-Butadiene Rubber (E-SBR), Styrene-Butadiene Rubber (S-SBR), Butadiene Rubber (BR), Ethylene-Propylene-Diene Rubber (EPDM), Butyl Rubber (IIR), Acrylonitrile-Butadiene Rubber (NBR), Chlorobutadiene (CR) & Polyisoprene (IR) |
| Company Profiles | ARLANXEO Holding B.V., Bridgestone Corporation, ExxonMobil Chemical Company, Goodyear Tire & Rubber Company, JSR Corporation, Korea Kumho Petrochemical Co., Ltd. (KKPC), Lanxess AG, Nizhnekamskneftekhim JSC (NKNK), PetroChina Company Limited (CNPC), Synthos S.A., and Versalis S.p.A. (Selection) |
| Edition | 4th edition |
| Publication | January 2022 |
FAQs
How many tons of synthetic rubber are consumed per year?
A total of more than 11.8 million tons are consumed per year.
What is the most important area of application for synthetic elastomers?
The most important area of application is tires for all types of vehicles: around 54% of total global consumption is accounted for by original and replacement tires.
Which product type is developing most dynamically?
Demand for S-SBR is developing most dynamically, with growth rates of 3.0% per year.
Which application areas of synthetic elastomers are considered in this report?
The following application areas are considered: Tires, vehicles, industrial and construction products, modification of materials and other uses.
1 Market Data: World and Regions
1.1 World
1.1.1 Demand
1.1.2 Revenues
1.1.3 Production
1.1.4 Applications
1.1.4.1 Tires
1.1.4.2 Transportation
1.1.4.3 Industry / Construction
1.1.4.4 Modification
1.1.4.5 Other Applications
1.1.5 Products
1.1.5.1 Styrene Butadiene Rubber (S-SBR)
1.1.5.2 Styrene-Butadiene Rubber (E-SBR)
1.1.5.3 Butadiene Rubber (BR)
1.1.5.4 Ethylene Propylene Diene Monomer (EPDM) Rubber
1.1.5.5 Butyl Rubber (IIR)
1.1.5.6 Acrylonitrile Butadiene Rubber (NBR)
1.1.5.7 Chlorobutadiene Rubber and Polyisoprene Rubber (CR & IR)
1.2 Western Europe
1.2.1 Demand
1.2.2 Revenues
1.2.3 Production
1.2.4 Applications and Products
1.3 Eastern Europe
1.3.1 Demand
1.3.2 Revenues
1.3.3 Production
1.3.4 Applications and Products
1.4 North America
1.4.1 Demand
1.4.2 Revenues
1.4.3 Production
1.4.4 Applications and Products
1.5 South America
1.5.1 Demand
1.5.2 Revenues
1.5.3 Production
1.5.4 Applications and Products
1.6 Asia-Pacific
1.6.1 Demand
1.6.2 Revenues
1.6.3 Production
1.6.4 Applications and Products
1.7 Middle East / Africa
1.7.1 Demand
1.7.2 Revenues
1.7.3 Production
1.7.4 Applications and Products
2 Market Data: Countries
2.1 Western Europe
2.1.1 Belgium
2.1.1.1 Demand and Revenues
2.1.1.2 Production and Trade
2.1.2 France
2.1.2.1 Demand and Revenues
2.1.2.2 Production and Trade
2.1.3 Germany
2.1.3.1 Demand and Revenues
2.1.3.2 Production and Trade
2.1.4 Italy
2.1.4.1 Demand and Revenues
2.1.4.2 Production and Trade
2.1.5 Spain
2.1.6 The Netherlands
2.1.6.1 Demand and Revenues
2.1.6.2 Production and Trade
2.1.7 United Kingdom
2.1.7.1 Demand and Revenues
2.1.7.2 Production and Trade
2.1.8 Other Western Europe
2.2 Eastern Europe
2.2.1 Czechia
2.2.1.1 Demand and Revenues
2.2.1.2 Production and Trade
2.2.2 Poland
2.2.2.1 Demand and Revenues
2.2.2.2 Production and Trade
2.2.3 Romania
2.2.4 Russia
2.2.4.1 Demand and Revenues
2.2.4.2 Production and Trade
2.2.5 Turkey
2.2.6 Other Eastern Europe
2.2.6.1 Demand and Revenues
2.2.6.2 Production and Trade
2.3 North America
2.3.1 Canada
2.3.1.1 Demand and Revenues
2.3.1.2 Production and Trade
2.3.2 Mexico
2.3.2.1 Demand and Revenues
2.3.2.2 Production and Trade
2.3.3 USA
2.3.3.1 Demand and Revenues
2.3.3.2 Production and Trade
2.4 South America
2.4.1 Argentina
2.4.1.1 Demand and Revenues
2.4.1.2 Production and Trade
2.4.2 Brazil
2.4.2.1 Demand and Revenues
2.4.2.2 Production and Trade
2.4.3 Other South America
2.5 Asia-Pacific
2.5.1 China
2.5.1.1 Demand and Revenues
2.5.1.2 Production and Trade
2.5.2 India
2.5.2.1 Demand and Revenues
2.5.2.2 Production and Trade
2.5.3 Indonesia
2.5.3.1 Demand and Revenues
2.5.3.2 Production and Trade
2.5.4 Japan
2.5.4.1 Demand and Revenues
2.5.4.2 Production and Trade
2.5.5 Malaysia
2.5.5.1 Demand and Revenues
2.5.5.2 Production and Trade
2.5.6 South Korea
2.5.6.1 Demand and Revenues
2.5.6.2 Production and Trade
2.5.7 Taiwan
2.5.7.1 Demand and Revenues
2.5.7.2 Production and Trade
2.5.8 Thailand
2.5.8.1 Demand and Revenues
2.5.8.2 Production and Trade
2.5.9 Other Asia-Pacific
2.5.9.1 Demand and Revenues
2.5.9.2 Production and Trade
3 Company Profiles*
3.1 Western Europe
France (1 Producer)
Germany (1)
Italy (1)
Spain (1)
The Netherlands (1)
3.2 Eastern Europe
Hungary (1)
Poland (1)
Russia (4)
Serbia (1)
3.3 North America
USA (5)
3.4 South America
Argentina (1)
3.5 Asia-Pacific
China (17)
India (2)
Indonesien (1)
Japan (14)
South Korea (5)
Taiwan (3)
Thailand (2)
3.6 Middle East
Iran (2)
Saudi Arabia (2)
*Note: The profiles are assigned to the country in which the company or holding is headquartered. Profiles also include JVs and subsidiaries.
Graph 1: Global demand for rubber from 2018 to 2030
Graph 2: Global demand for synthetic rubbers from 2018 to 2030 – split by regions
Graph 3: Global revenues generated with rubber from 2018 to 2030 in billion USD and billion EUR
Graph 4: Global revenues generated with synthetic rubbers from 2018 to 2030 in billion USD – split by regions
Graph 5: Global revenues generated with synthetic rubbers from 2018 to 2030 in billion EUR – split by regions
Graph 6: Global production of rubber from 2018 to 2030
Graph 7: Global production of rubber from 2018 to 2030 – split by regions
Graph 8: Global demand for synthetic rubbers from 2018 to 2030 – split by applications
Graph 9: Global demand for synthetic rubber in the segment tires from 2018 to 2030 – split by regions
Graph 10: Global demand for synthetic rubbers in the segment transportation from 2018 to 2030 – split by regions
Graph 11: Global demand for synthetic rubbers in the segment “industry / construction” from 2018 to 2030 – split by regions
Graph 12: Global demand for rubber in the segment modification from 2018 to 2030 – split by regions
Graph 13: Global demand for synthetic rubbers in other applications from 2018 to 2030 – split by regions
Graph 14: Global demand for synthetic rubbers from 2018 to 2030 – split by products
Graph 15: Global demand for S-SBR from 2018 to 2030 – split by regions
Graph 16: Global demand for E-SBR from 2018 to 2030 – split by regions
Graph 17: Global demand for BR from 2018 to 2030 – split by regions
Graph 18: Global demand for EPDM from 2018 to 2030 – split by regions
Graph 19: Global demand for IIR from 2018 to 2030 – split by regions
Graph 20: Global demand for NBR from 2018 to 2030 – split by regions
Graph 21: Global demand for IR & CR from 2018 bis 2030 – split by regions
Graph 22: Demand for synthetic rubbers in Western Europe from 2018 to 2030
Graph 23: Revenues generated with synthetic rubbers in Western Europe from 2018 to 2030 in billion USD and billion EUR
Graph 24: Production of rubber in Western Europe from 2018 to 2030
Graph 25: Demand for synthetic rubbers in Western Europe from 2018 to 2030 – split by applications
Graph 26: Demand for rubber in Eastern Europe from 2018 to 2030
Graph 27: Revenues generated with rubber in Eastern Europe from 2018 to 2030 in billion USD and billion EUR
Graph 28: Production of rubber in Eastern Europe from 2018 to 2030
Graph 29: Demand for synthetic rubbers in Eastern Europe from 2018 to 2030 – split by applications
Graph 30: Demand for synthetic rubbers in North America from 2018 to 2030
Graph 31: Revenues generated with synthetic rubbers in North America from 2018 to 2030 in billion USD and billion EUR
Graph 32: Production of synthetic rubbers in North America from 2018 to 2030
Graph 33: Demand for synthetic rubbers in North America from 2018 to 2030 – split by applications
Graph 34: Demand for rubber in South America from 2018 to 2030
Graph 35: Revenues generated with synthetic rubbers in South America from 2018 to 2030 in billion USD and billion EUR
Graph 36: Production of rubber in South America from 2018 to 2030
Graph 37: Demand for synthetic rubbers in South America from 2018 to 2030 – split by applications
Graph 38: Demand for synthetic rubbers in Asia-Pacific from 2018 to 2030
Graph 39: Revenues generated with rubber in Asia-Pacific from 2018 to 2030 in billion USD and billion EUR
Graph 40: Production of rubber in Asia-Pacific from 2018 to 2030
Graph 41: Demand for synthetic rubbers in Asia-Pacific from 2018 to 2030 – split by applications
Graph 42: Demand for synthetic rubbers in the Middle East and Africa from 2018 to 2030
Graph 43: Revenues generated with synthetic rubbers in the Middle East and Africa from 2018 to 2030 in billion USD and billion EUR
Graph 44: Production of synthetic rubbers in the Middle East and Africa from 2018 to 2030
Graph 45: Demand for synthetic rubbers in the Middle East and Africa from 2019 to 2030 – split by applications
Graph 46: Demand for synthetic rubbers in Belgium from 2018 to 2030
Graph 47: Production of synthetic rubbers in Belgium from 2018 to 2030
Graph 48: Demand for synthetic rubbers in France from 2018 to 2030
Graph 49: Production of synthetic rubbers in France from 2018 to 2030
Graph 50: Demand for synthetic rubbers in Germany from 2018 to 2030
Graph 51: Production of synthetic rubbers in Germany from 2018 to 2030
Graph 52: Demand for synthetic rubbers in Italy from 2018 to 2030
Graph 53: Production of rubber in Italy from 2018 to 2030
Graph 54: Demand for synthetic rubbers in Spain from 2018 to 2030
Graph 55: Demand for synthetic rubbers in the Netherlands from 2018 to 2030
Graph 56: Production of synthetic rubbers in the Netherlands from 2018 to 2030
Graph 57: Demand for synthetic rubbers in the United Kingdom from 2018 to 2030
Graph 58: Production of synthetic rubbers in the United Kingdom from 2018 to 2030
Graph 59: Demand for synthetic rubbers in Other Western Europe from 2018 to 2030
Graph 60: Demand for synthetic rubbers in Czechia from 2018 to 2030
Graph 61: Production of rubber in Czechia from 2018 to 2030
Graph 62: Demand for synthetic rubbers in Poland from 2009 to 2025
Graph 63: Production of synthetic rubbers in Poland from 2018 to 2030
Graph 64: Demand for synthetic rubbers in Romania from 2018 to 2030
Graph 65: Demand for rubber in Russia from 2018 to 2030
Graph 66: Production of synthetic rubbers in Russia from 2018 to 2030
Graph 67: Demand for synthetic rubbers in Turkey from 2018 to 2030
Graph 68: Demand for rubber in Other Eastern Europe from 2018 to 2030
Graph 69: Production of rubber in Other Eastern Europe from 2018 to 2030
Graph 70: Demand for synthetic rubbers in Canada from 2018 to 2030
Graph 71: Production of synthetic rubbers in Canada from 2018 to 2030
Graph 72: Demand for rubber in Mexico from 2018 to 2030
Graph 73: Production of synthetic rubbers in Mexico from 2018 to 2030
Graph 74: Demand for rubber in the USA from 2018 to 2030
Graph 75: Production of synthetic rubbers in the USA from 2018 to 2030
Graph 76: Demand for synthetic rubbers in Argentina from 2018 to 2030
Graph 77: Production of synthetic rubbers in Argentina from 2018 to 2030
Graph 78: Demand for synthetic rubbers in Brazil from 2018 to 2030
Graph 79: Production of synthetic rubbers in Brazil from 2018 to 2030
Graph 80: Demand for synthetic rubbers in Other South America from 2018 to 2030
Graph 81: Demand for rubber in China from 2018 to 2030
Graph 82: Production of synthetic rubbers in China from 2018 to 2030
Graph 83: Demand for synthetic rubber in India from 2018 to 2030
Graph 84: Production of synthetic rubbers in India from 2018 to 2030
Graph 85: Demand for rubber in Indonesia from 2018 to 2030
Graph 86: Production of synthetic rubbers in Indonesia from 2018 to 2030
Graph 87: Demand for synthetic rubbers in Japan from 2018 to 2030
Graph 88: Production of synthetic rubbers in Japan from 2018 to 2030
Graph 89: Demand for synthetic rubbers in Malaysia from 2018 to 2030
Graph 90: Production of synthetic rubbers in Malaysia from 2018 to 2030
Graph 91: Demand for synthetic rubbers in South Korea from 2018 to 2030
Graph 92: Production of rubber in South Korea from 2018 to 2030
Graph 93: Demand for synthetic rubbers in Taiwan from 2018 to 2030
Graph 94: Production of rubber in Taiwan from 2018 to 2030
Graph 95: Demand for synthetic rubbers in Thailand from 2018 to 2030
Graph 96: Production of synthetic rubbers in Thailand from 2018 to 2030
Graph 97: Demand for synthetic rubbers in Other Asia-Pacific from 2018 to 2030
Graph 98: Production of synthetic rubbers in Other Asia-Pacific from 2018 to 2030
Table 1: Global demand for synthetic rubbers from 2018 to 2030 – split by regions
Table 2: Global revenues generated with synthetic rubbers from 2018 to 2030 in million USD – split by regions
Table 3: Global revenues generated with synthetic rubbers from 2018 to 2030 in million EUR – split by regions
Table 4: Global production of rubber from 2018 to 2030 – split by regions
Table 5: Global demand for synthetic rubbers from 2018 to 2030 – split by applications
Table 6: Global demand for synthetic rubbers in the segment tires from 2018 to 2030 – split by regions
Table 7: Global demand for synthetic rubbers in the segment transportation from 2018 to 2030 – split by regions
Table 8: Global demand for synthetic rubbers in the segment “industry / construction” from 2018 to 2030 – split by regions
Table 9: Global demand for synthetic rubbers in the segment modification from 2018 to 2030 – split by regions
Table 10: Global demand for synthetic rubbers in other applications from 2018 to 2030 – split by regions
Table 11: Global demand for synthetic rubbers from 2018 to 2030 – split by products
Table 12: Global demand for S-SBR from 2018 to 2030 – split by regions
Table 13: Global demand for E-SBR from 2018 to 2030 – split by regions
Table 14: Global demand for BR from 2018 to 2030 – split by regions
Table 15: Global demand for EPDM from 2018 to 2030 – split by regions
Table 16: Global demand for IIR from 2018 to 2030 – split by regions
Table 17: Global demand for NBR from 2018 to 2030 – split by regions
Table 18: Global demand for IR & CR from 2018 bis 2030 – split by regions
Table 19: Demand for synthetic rubbers in Western Europe from 2018 to 2030 – split by major countries
Table 20: Revenues generated with synthetic rubbers in Western Europe from 2018 to 2030 in million USD and million EUR
Table 21: Production of synthetic rubbers in Western Europe from 2018 to 2030 – split by major countries
Table 22: Demand for synthetic rubbers in Western Europe from 2018 to 2030 – split by applications
Table 23: Demand for synthetic rubbers in Western Europe from 2018 to 2030 – split by products
Table 24: Demand for synthetic rubbers in Eastern Europe from 2018 to 2030 – split by major countries
Table 25: Revenues generated with synthetic rubbers in Eastern Europe from 2018 to 2030 in million USD and million EUR
Table 26: Production of synthetic rubbers in Eastern Europe from 2018 to 2030 – split by major countries
Table 27: Demand for synthetic rubbers in Eastern Europe from 2018 to 2030 – split by applications
Table 28: Demand for synthetic rubbers in Eastern Europe from 2018 to 2030 – split by products
Table 29: Demand for synthetic rubbers in North America from 2018 to 2030 – split by major countries
Table 30: Revenues generated with synthetic rubbers in North America from 2018 to 2030 in million USD and million EUR
Table 31: Production of synthetic rubbers in North America from 2018 to 2030 – split by major countries
Table 32: Demand for synthetic rubbers in North America from 2018 to 2030 – split by applications
Table 33: Demand for synthetic rubbers in North America from 2018 to 2030 – split by products
Table 34: Demand for synthetic rubbers in South America from 2018 to 2030 – split by major countries
Table 35: Revenues generated with synthetic rubbers in South America from 2018 to 2030 in million USD and million EUR
Table 36: Production of synthetic rubbers in South America from 2018 to 2030 – split by major countries
Table 37: Demand for synthetic rubbers in South America from 2018 to 2030 – split by applications
Table 38: Demand for synthetic rubbers in South America from 2018 to 2030 – split by products
Table 39: Demand for synthetic rubbers in Asia-Pacific from 2018 to 2030 – split by major countries
Table 40: Revenues generated with synthetic rubbers in Asia-Pacific from 2018 to 2030 in million USD and million EUR
Table 41: Production of synthetic rubbers in Asia-Pacific from 2018 to 2030 – split by major countries
Table 42: Demand for synthetic rubbers in Asia-Pacific from 2018 to 2030 – split by applications
Table 43: Demand for synthetic rubbers in Asia-Pacific from 2018 to 2030 – split by products
Table 44: Revenues generated with synthetic rubbers in the Middle East / Africa from 2018 to 2030 in million USD and million EUR
Table 45: Demand for synthetic rubbers in the Middle East / Africa from 2018 to 2030 – split by applications
Table 46: Demand for synthetic rubbers in the Middle East / Africa from 2018 to 2030 – split by products
Table 47: Revenues generated with synthetic rubbers in Belgium from 2018 to 2030 in million USD and million EUR
Table 48: Demand for synthetic rubbers in Belgium from 2018 to 2030 – split by applications
Table 49: Demand for synthetic rubbers in Beglium from 2018 to 2030 – split by products
Table 50: Production, import, and export of and demand for synthetic rubbers in Belgium from 2018 to 2030
Table 51: Revenues generated with synthetic rubbers in France from 2018 to 2030 in million USD and million EUR
Table 52: Demand for synthetic rubbers in France from 2018 to 2030 – split by applications
Table 53: Demand for synthetic rubbers in France from 2018 to 2030 – split by products
Table 54: Production, import, and export of and demand for synthetic rubbers in France from 2018 to 2030
Table 55: Revenues generated with synthetic rubbers in Germany from 2018 to 2030 in million USD and million EUR
Table 56: Demand for synthetic rubbers in Germany from 2018 to 2030 – split by applications
Table 57: Demand for synthetic rubbers in Germany from 2018 to 2030 – split by products
Table 58: Production, import, and export of and demand for synthetic rubbers in Germany from 2018 to 2030
Table 59: Revenues generated with synthetic rubbers in Italy from 2018 to 2030 in million USD and million EUR
Table 60: Demand for synthetic rubbers in Italy from 2018 to 2030 – split by applications
Table 61: Demand for synthetic rubbers in Italy from 2018 to 2030 – split by products
Table 62: Production, import, and export of and demand for synthetic rubbers in Italy from 2018 to 2030
Table 63: Revenues generated with synthetic rubbers in Spain from 2018 to 2030 in million USD and million EUR
Table 64: Demand for synthetic rubbers in Spain from 2018 to 2030 – split by applications
Table 65: Demand for synthetic rubbers in Spain from 2018 to 2030 – split by products
Table 66: Revenues generated with synthetic rubbers in the Netherlands from 2018 to 2030 in million USD and million EUR
Table 67: Demand for synthetic rubbers in the Netherlands from 2018 to 2030 – split by applications
Table 68: Demand for synthetic rubbers in the Netherlands from 2018 to 2030 – split by products
Table 69: Production, import, and export of and demand for synthetic rubbers in the Netherlands from 2018 to 2030
Table 70: Revenues generated with synthetic rubbers in the United Kingdom from 2018 to 2030 in million USD and million EUR
Table 71: Demand for synthetic rubbers in the United Kingdom from 2018 to 2030 – split by applications
Table 72: Demand for synthetic rubbers in the United Kingdom from 2018 to 2030 – split by products
Table 73: Production, import, and export of and demand for synthetic rubbers in the United Kingdom from 2018 to 2030
Table 74: Revenues generated with synthetic rubbers in Other Western Europe from 2018 to 2030 in million USD and million EUR
Table 75: Demand for synthetic rubbers in Other Western Europe from 2018 to 2030 – split by applications
Table 76: Demand for synthetic rubbers in Other Western Europe from 2018 to 2030 – split by products
Table 77: Revenues generated with synthetic rubbers in Czechia from 2018 to 2030 in million USD and million EUR
Table 78: Demand for synthetic rubbers in Czechia from 2018 to 2030 – split by applications
Table 79: Demand for synthetic rubbers in Czechia from 2018 to 2030 – split by products
Table 80: Production, import, and export of and demand for synthetic rubbers in Czechia from 2018 to 2030
Table 81: Revenues generated with synthetic rubbers in Poland from 2018 to 2030 in million USD and million EUR
Table 82: Demand for synthetic rubbers in Poland from 2018 to 2030 – split by applications
Table 83: Demand for synthetic rubbers in Poland from 2018 to 2030 – split by products
Table 84: Production, import, and export of and demand for synthetic rubbers in Poland from 2018 to 2030
Table 85: Revenues generated with synthetic rubbers in Romania from 2018 to 2030 in million USD and million EUR
Table 86: Demand for rubber in Romania from 2018 to 2030 – split by applications
Table 87: Demand for synthetic rubbers in Romania from 2018 to 2030 – split by products
Table 88: Revenues generated with synthetic rubbers in Russia from 2018 to 2030 in million USD and million EUR
Table 89: Demand for rubber in Russia from 2018 to 2030 – split by applications
Table 90: Demand for synthetic rubbers in Russia from 2018 to 2030 – split by products
Table 91: Production, import, and export of and demand for synthetic rubbers in Russia from 2018 to 2030
Table 92: Revenues generated with synthetic rubbers in Turkey from 2018 to 2030 in million USD and million EUR
Table 93: Demand for synthetic rubbers in Turkey from 2018 to 2030 – split by applications
Table 94: Demand for synthetic rubbers in Turkey from 2018 to 2030 – split by products
Table 95: Revenues generated with synthetic rubbers in Other Eastern Europe from 2018 to 2030 in billion USD and billion EUR
Table 96: Demand for synthetic rubbers in Other Eastern Europe from 2018 to 2030 – split by applications
Table 97: Demand for synthetic rubbers in Other Eastern Europe from 2018 to 2030 – split by products
Table 98: Production, import, and export of and demand for synthetic rubbers in the remaining countries of Eastern Europe from 2018 to 2030
Table 99: Revenues generated with synthetic rubber in Canada from 2018 to 2030 in million USD and million EUR
Table 100: Demand for synthetic rubbers in Canada from 2018 to 2030 – split by applications
Table 101: Demand for synthetic rubbers in Canada from 2018 to 2030 – split by products
Table 102: Production, import, and export of and demand for synthetic rubbers in Canada from 2018 to 2030
Table 103: Revenues generated with synthetic rubbers in Mexico from 2018 to 2030 in million USD and million EUR
Table 104: Demand for synthetic rubbers in Mexico from 2018 to 2030 – split by applications
Table 105: Demand for synthetic rubbers in Mexico from 2018 to 2030 – split by products
Table 106: Production, import, and export of and demand for synthetic rubbers in Mexico from 2018 to 2030
Table 107: Revenues generated with rubber in the USA from 2018 to 2030 in million USD and million EUR
Table 108: Demand for synthetic rubber in the USA from 2018 to 2030 – split by applications
Table 109: Demand for synthetic rubbers in the USA from 2018 to 2030 – split by products
Table 110: Production, import, and export of and demand for synthetic rubbers in the USA from 2018 to 2030
Table 111: Revenues generated with synthetic rubbers in Argentina from 2018 to 2030 in million USD and million EUR
Table 112: Demand for synthetic rubbers in Argentina from 2018 to 2030 – split by applications
Table 113: Demand for synthetic rubbers in Argentina from 2018 to 2030 – split by products
Table 114: Production, import, and export of and demand for synthetic rubbers in Argentina from 2018 to 2030
Table 115: Revenues generated with synthetic rubbers in Brazil from 2018 to 2030 in million USD and million EUR
Table 116: Demand for synthetic rubbers in Brazil from 2018 to 2030 – split by applications
Table 117: Demand for synthetic rubbers in Brazil from 2018 to 2030 – split by products
Table 118: Production, import, and export of and demand for synthetic rubbers in Brazil from 2018 to 2030
Table 119: Revenues generated with synthetic rubbers in Other South America from 2018 to 2030 in million USD and million EUR
Table 120: Demand for synthetic rubber in Other South America from 2018 to 2030 – split by applications
Table 121: Demand for synthetic rubbers in Other South America from 2018 to 2030 – split by products
Table 122: Revenues generated with synthetic rubbers in China from 2018 to 2030 in million USD and million EUR
Table 123: Demand for synthetic rubbers in China from 2018 to 2030 – split by applications
Table 124: Demand for synthetic rubbers in China from 2018 to 2030 – split by products
Table 125: Production, import, and export of and demand for synthetic rubbers in China from 2018 to 2030
Table 126: Revenues generated with synthetic rubbers in India from 2018 to 2030 in million USD and million EUR
Table 127: Demand for synthetic rubbers in India from 2018 to 2030 – split by applications
Table 128: Demand for synthetic rubbers in India from 2018 to 2030 – split by products
Table 129: Production, import, and export of and demand for synthetic rubbers in India from 2018 to 2030
Table 130: Revenues generated with synthetic rubbers in Indonesia from 2018 to 2030 in million USD and million EUR
Table 131: Demand for synthetic rubber in Indonesia from 2018 to 2030 – split by applications
Table 132: Demand for synthetic rubbers in Indonesia from 2018 to 2030 – split by products
Table 133: Production, import, and export of and demand for synthetic rubbers in Indonesia from 2018 to 2030
Table 134: Revenues generated with synthetic rubbers in Japan from 2018 to 2030 in million USD and million EUR
Table 135: Demand for synthetic rubbers in Japan from 2018 to 2030 – split by applications
Table 136: Demand for synthetic rubbers in Japan from 2018 to 2030 – split by products
Table 137: Production, import, and export of and demand for synthetic rubbers in Japan from 2018 to 2030
Table 138: Revenues generated with synthetic rubber in Malaysia from 2018 to 2030 in million USD and million EUR
Table 139: Demand for synthetic rubbers in Malaysia from 2018 to 2030 – split by applications
Table 140: Demand for synthetic rubbers in Malaysia from 2018 to 2030 – split by products
Table 141: Production, import, and export of and demand for synthetic rubbers in Malaysia from 2018 to 2030
Table 142: Revenues generated with synthetic rubbers in South Korea from 2018 to 2030 in million USD and million EUR
Table 143: Demand for synthetic rubbers in South Korea from 2018 to 2030 – split by applications
Table 144: Demand for synthetic rubbers in South Korea from 2018 to 2030 – split by products
Table 145: Production, import, and export of and demand for synthetic rubbers in South Korea from 2018 to 2030
Table 146: Revenues generated with synthetic rubber in Taiwan from 2018 to 2030 in million USD and million EUR
Table 147: Demand for synthetic rubbers in Taiwan from 2018 to 2030 – split by applications
Table 148: Demand for synthetic rubbers in Taiwan from 2018 to 2030 – split by products
Table 149: Production, import, and export of and demand for synthetic rubbers in Taiwan from 2018 to 2030
Table 150: Revenues generated with synthetic rubbers in Thailand from 2018 to 2030 in million USD and million EUR
Table 151: Demand for synthetic rubbers in Thailand from 2018 to 2030 – split by applications
Table 152: Demand for synthetic rubbers in Thailand from 2018 to 2030 – split by products
Table 153: Production, import, and export of and demand for synthetic rubbers in Thailand from 2018 to 2030
Table 154: Revenues generated with synthetic rubbers in Other Asia-Pacific from 2018 to 2030 in million USD and million EUR
Table 155: Demand for synthetic rubbers in Other Asia-Pacific from 2018 to 2030 – split by applications
Table 156: Demand for synthetic rubbers in Other Asia-Pacific from 2018 to 2030 – split by products
Table 157: Production, import, and export of and demand for synthetic rubbers in the remaining countries of Asia-Pacific from 2018 to 2030


