

Description
This study is currently being completely revised. We plan to publish the 4th edition in October 2024. Therefore we can offer you the update for free, if you order the current edition now.
The Silicones Market Report is now also available in parts (e.g. individual country profiles or all manufacturer profiles). Please feel free to contact us and we will immediately send you an offer for your specific selection.
Flexible without plasticizers, heat and cold resistant, skin-friendly, water-repellent but permeable to water vapor: Silicones offer characteristics that cannot be fulfilled by any other plastics. In many industrial branches, these innovative materials are used for diverse products. The most important types of silicones are silicone elastomers, silicone oils, and silicone resins. Application areas are construction, automotive, electrical and electronics, medical technology, cosmetics, textiles, and paper. Ceresana examined the global silicone market already for the third time: Global revenues amounted to over USD 16.3 billion in 2017. Ceresana expects the silicone market to increase further by 3.9% p.a. until 2025.
Diverse Silicone Market
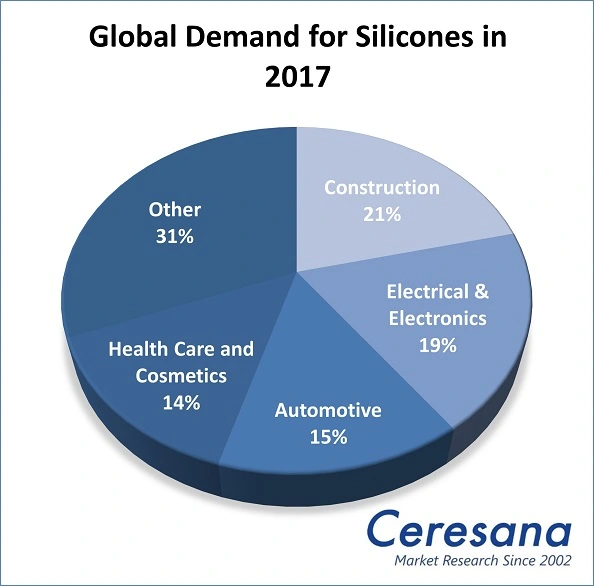
A decisive advantage for manufacturers of silicones is the variety of sales markets: Demand is distributed evenly among several large sectors. In the construction industry, for example, silicones are mainly used as sealants, adhesives, and in coatings. The electronic industry applies silicones mainly to protect electronic components from extreme heat, moisture, salt, corrosion, and contamination. Among others, computers, telephones, and LED lights contain silicones and the application areas are being gradually expanded. Silicone demand in the automotive segment will presumably register similarly high growth rates in the upcoming eight years as in the electrical and electronics industry. Innovative projects such as hybrid and electric vehicles or autonomous vehicles will support this growth. In 2017, however, the construction industry was the segment with the highest silicone consumption.
Different Types of Silicones
A large part of the global production and revenues of silicones is accounted for by silicone elastomers which are, for example, used in seals, electrical insulations or baking tins. A distinction is made between solid and liquid silicone rubber. In regard to silicone elastomers, the highest revenues are generated in the region Asia-Pacific. In Western Europe and North America, revenues generated with elastomers are slightly higher than revenues generated with silicone oils. Silicone resins that are for example used for paints and coatings have so far been accounting for a much smaller market share in all regions, but are likely to develop at sound growth rates in the future.
Market Trends of the Silicones Industry
The region Asia-Pacific is, by far, the major producer of silicones worldwide. Ceresana expects the production in this region to continue to grow. Western Europe accounts for the second highest production figures, while silicone market size in North America is slightly lower. Asia-Pacific, China in particular, is also the largest consumer of silicones. The gap to the second and third largest sales markets, Western Europe and North America, is likely to continue to widen in the future. Yet, established industrialized countries report a higher market value compared to silicone demand, as China tends to consume cheaper products instead of high-end specialty silicones.
The Study in Brief:
Chapter 1 provides a description and analysis of the global silicone market, including forecasts up to 2025: demand (in tonnes), revenues per product type, total revenues, and production volume are explained for each region of the world. This chapter also includes a concise and precise summary of the most important facts regarding production and characteristics of silicones and individual product types.
Chapter 2 contains a detailed analysis of total demand, revenues generated with silicones as well as market value in construction, E&E, automotive, health care and cosmetics as well as in other applications for 15 countries.
Chapter 3 offers a well-grounded analysis of various applications of silicones: Data on demand and sales development, split by the world regions Western Europe, Eastern Europe, North America, South America, Asia-Pacific, and the Middle East/ Africa are given.
Chapter 4 provides company profiles of the largest silicone manufacturers – clearly arranged according to contact details, revenues, profit, product range, production sites, and profile summary. Extensive profiles of 58 producers are given, including 3M Company, Asahi Kasei Corporation, Compagnie de Saint-Gobain S.A., DowDuPont, Evonik Industries AG, Henkel AG & Co. KGaA, PPG Industries Inc., Shin-Etsu Chemical Co., Ltd., and The Sherwin-Williams Company.
Scope of the Report:
Attributes | Details |
| Base Year | 2017 |
| Trend Period | 2009 – 2025 |
| Forecast Period | 2018 – 2025 |
| Pages | 290 |
| Application Areas | Construction, Electrical & Electronics, Automotive, Health Care & Cosmetics, Other Applications |
| Silicone Types | Silicone Elastomers, Silicone Oils, Silicone Resins |
| Company Profiles | 3M Company, Asahi Kasei Corporation, Compagnie de Saint-Gobain S.A., DowDuPont, Evonik Industries AG, Henkel AG & Co. KGaA, PPG Industries Inc., Shin-Etsu Chemical Co., Ltd., and The Sherwin-Williams Company (Selection) |
| Edition | 3rd edition |
| Publication | January 2019 |
FAQs
What was the revenue generated with silicones in 2017?
Global revenues amounted to over USD 16.3 billion in 2017.
How is the silicone market expected to develop until 2025?
According to Ceresana’s forecasts, the silicone market will continue to increase at an average annual rate of 3.9% until 2025.
Which application area had the highest silicone consumption in 2017?
In 2017, the largest silicone consumer was the construction industry.
1 Market Data: World and Regions
1.1 World
1.1.1 Demand
1.1.2 Revenues
1.1.3 Production
1.2 Western Europe
1.2.1 Demand
1.2.2 Revenues
1.2.3 Production
1.3 Eastern Europe
1.3.1 Demand
1.3.2 Revenues
1.3.3 Production
1.4 North America
1.4.1 Demand
1.4.2 Revenues
1.4.3 Production
1.5 South America
1.5.1 Demand
1.5.2 Revenues
1.5.3 Production
1.6 Asia-Pacific
1.6.1 Demand
1.6.2 Revenues
1.6.3 Production
1.7 Middle East & Africa
1.7.1 Demand
1.7.2 Revenues
2 Market Data: Countries
2.1 Western Europe
2.1.1 France
2.1.1.1 Demand and Revenues
2.1.1.2 Revenues per Application
2.1.2 Germany
2.1.2.1 Demand and Revenues
2.1.2.2 Revenues per Application
2.1.3 Italy
2.1.3.1 Demand and Revenues
2.1.3.2 Revenues per Application
2.1.4 Spain
2.1.4.1 Demand and Revenues
2.1.4.2 Revenues per Application
2.1.5 United Kingdom
2.1.5.1 Demand and Revenues
2.1.5.2 Revenues per Application
2.1.6 Other Western Europe
2.1.6.1 Demand and Revenues
2.1.6.2 Revenues per Application
2.2 Eastern Europe
2.2.1 Russia
2.2.1.1 Demand and Revenues
2.2.1.2 Revenues per Application
2.2.2 Turkey
2.2.2.1 Demand and Revenues
2.2.2.2 Revenues per Application
2.2.3 Other Eastern Europe
2.2.3.1 Demand and Revenues
2.2.3.2 Revenues per Application
2.3 North America
2.3.1 Canada
2.3.1.1 Demand and Revenues
2.3.1.2 Revenues per Application
2.3.2 Mexico
2.3.2.1 Demand and Revenues
2.3.2.2 Revenues per Application
2.3.3 USA
2.3.3.1 Demand and Revenues
2.3.3.2 Revenues per Application
2.4 South America
2.4.1 Brazil
2.4.1.1 Demand and Revenues
2.4.1.2 Revenues per Application
2.4.2 Other South America
2.4.2.1 Demand and Revenues
2.4.2.2 Revenues per Application
2.5 Asia-Pacific
2.5.1 China
2.5.1.1 Demand and Revenues
2.5.1.2 Revenues per Application
2.5.2 India
2.5.2.1 Demand and Revenues
2.5.2.2 Revenues per Application
2.5.3 Japan
2.5.3.1 Demand and Revenues
2.5.3.2 Revenues per Application
2.5.4 South Korea
2.5.4.1 Demand and Revenues
2.5.4.2 Revenues per Application
2.5.5 Other Asia-Pacific
2.5.5.1 Demand and Revenues
2.5.5.2 Revenues per Application
3 Market Data: Applications
3.1 World
3.1.1 Construction
3.1.2 Electrical and Electronics
3.1.3 Automotive
3.1.4 Health Care and Cosmetics Industry
3.1.5 Other Applications
3.2 Western Europe
3.2.1 Construction
3.2.2 Electrical and Electronics
3.2.3 Automotive
3.2.4 Health Care and Cosmetics Industry
3.2.5 Other Applications
3.3 Eastern Europe
3.3.1 Construction
3.3.2 Electrical and Electronics
3.3.3 Automotive
3.3.4 Health Care and Cosmetics Industry
3.3.5 Other Applications
3.4 North America
3.4.1 Construction
3.4.2 Electrical and Electronics
3.4.3 Automotive
3.4.4 Health Care and Cosmetics Industry
3.4.5 Other Applications
3.5 South America
3.5.1 Construction
3.5.2 Electrical and Electronics
3.5.3 Automotive
3.5.4 Health Care and Cosmetics Industry
3.5.5 Other Applications
3.6 Asia-Pacific
3.6.1 Construction
3.6.2 Electrical and Electronics
3.6.3 Automotive
3.6.4 Health Care and Cosmetics Industry
3.6.5 Other Applications
3.7 Middle East and Africa
4 Company Profiles*
4.1 Western Europe
Austria (1 Producer)
Belgium (1)
Finland (1)
France (2)
Germany (9)
Italy (1)
Switzerland (2)
The Netherlands (2)
United Kingdom (1)
4.2 North America
USA (17)
4.3 Asia-Pacific
China (9)
Hong Kong (1)
India (2)
Japan (6)
Singapore (1)
South Korea (1)
4.4 Middle East
United Arab Emirates (1)
*Note: The profiles are assigned to the country in which the company or holding is headquartered. Profiles also include JVs and subsidiaries.
Graph 1: Simplified schematic of silicone production
Graph 2: Global demand for silicones from 2009 to 2025
Graph 3: Global demand for silicones from 2009 to 2025 – split by regions
Graph 4: Global revenues generated with silicones from 2009 to 2025 in billion USD and billion EUR
Graph 5: Euro-reference rate between 2009 and 2018: USD per EUR
Graph 6: Global revenues generated with silicones from 2009 to 2025 in billion USD – split by regions
Graph 7: Global revenues generated with silicones from 2009 to 2025 in billion EUR – split by regions
Graph 8: The most important product groups of silicone elastomers
Graph 9: Global production of silicones from 2009 to 2025
Graph 10: Global production of silicones from 2009 to 2025 – split by regions
Graph 11: Demand for silicones in Western Europe from 2009 to 2025
Graph 12: Revenues generated with silicones in Western Europe from 2009 to 2025 in billion USD and billion EUR
Graph 13: Production of silicones in Western Europe from 2009 to 2025
Graph 14: Demand for silicones in Eastern Europe from 2009 to 2025
Graph 15: Revenues generated with silicones in Eastern Europe from 2009 to 2025 in billion USD and billion EUR
Graph 16: Production of silicones in Eastern Europe from 2009 to 2025
Graph 17: Demand for silicones in North America from 2009 to 2025
Graph 18: Revenues generated with silicones in North America from 2009 to 2025 in billion USD and billion EUR
Graph 19: Production of silicones in North America from 2009 to 2025
Graph 20: Demand for silicones in South America from 2009 to 2025
Graph 21: Revenues generated with silicones in South America from 2009 to 2025 in billion USD and billion EUR
Graph 22: Production of silicones in South America from 2009 to 2025
Graph 23: Demand for silicones in Asia-Pacific from 2009 to 2025
Graph 24: Revenues generated with silicones in Asia-Pacific from 2009 to 2025 in billion USD and billion EUR
Graph 25: Production of silicones in Asia-Pacific from 2009 to 2025
Graph 26: Demand for silicones in the region Middle East & Africa from 2009 to 2025
Graph 27: Revenues generated with silicones in the region Middle East & Africa from 2009 to 2025 in billion USD and billion EUR
Graph 28: Demand for silicones in France from 2009 to 2025
Graph 29: Demand for silicones in Germany from 2009 to 2025
Graph 30: Demand for silicones in Italy from 2009 to 2025
Graph 31: Demand for silicones in Spain from 2009 to 2025
Graph 32: Demand for silicones in the United Kingdom from 2009 to 2025
Graph 33: Demand for silicones in Other Western Europe from 2009 to 2025
Graph 34: Demand for silicones in Russia from 2009 to 2025
Graph 35: Demand for silicones in Turkey from 2009 to 2025
Graph 36: Demand for silicone in Other Eastern Europe from 2009 to 2025
Graph 37: Demand for silicones in Canada from 2009 to 2025
Graph 38: Demand for silicones in Mexico from 2009 to 2025
Graph 39: Demand for silicones in the USA from 2009 to 2025
Graph 40: Demand for silicones in Brazil from 2009 to 2025
Graph 41: Demand for silicones in Other South America from 2009 to 2025
Graph 42: Demand for silicones in China from 2009 to 2025
Graph 43: Demand for silicones in India from 2009 to 2025
Graph 44: Demand for silicones in Japan from 2009 to 2025
Graph 45: Demand for silicones in South Korea from 2009 to 2025
Graph 46: Demand for silicones in Other Asia-Pacific from 2009 to 2025
Graph 47: Global revenues generated with silicones from 2009 to 2025 – split by applications
Graph 48: Global revenues generated with silicones in the construction industry from 2009 to 2025 – split by regions
Graph 49: Global revenues generated with silicones in the segment electrical and electronics from 2009 to 2025 – split by regions
Graph 50: Global revenues generated with silicones in the segment automotive from 2009 to 2025 – split by regions
Graph 51: Global revenues generated with silicones in the segment health care and cosmetics from 2009 to 2025 – split by regions
Graph 52: Global revenues generated with silicones in other applications from 2009 to 2025 – split by regions
Graph 53: Revenues generated with silicones in Western Europe from 2009 to 2025 – split by applications
Graph 54: Revenues generated with silicones in Eastern Europe from 2009 to 2025 – split by applications
Graph 55: Revenues generated with silicones in North America from 2009 to 2025 – split by applications
Graph 56: Revenues generated with silicones in South America from 2009 to 2025 – split by applications
Graph 57: Revenues generated with silicones in Asia-Pacific from 2009 to 2025 – split by applications
Graph 58: Revenues generated with silicones in the Middle East and Africa from 2009 to 2025 – split by applications
Table 1: Global demand for silicones from 2009 to 2025 – split by regions
Table 2: Global revenues generated with silicones from 2009 to 2025 in billion USD – split by regions
Table 3: Global revenues generated with silicones from 2009 to 2025 in billion EUR – split by regions
Table 4: Global revenues generated with silicones from 2009 to 2025 – split by product groups
Table 5: Global production of silicones from 2009 to 2025 – split by regions
Table 6: Demand for silicones in Western Europe from 2009 to 2025 – split by major countries
Table 7: Revenues generated with silicones in Western Europe from 2009 to 2025
Table 8: Revenues generated with silicones in Western Europe from 2009 to 2025 – split by product groups
Table 9: Production of silicones in Western Europe from 2009 to 2025 – split by major countries
Table 10: Demand for silicones in Eastern Europe from 2009 to 2025 – split by major countries
Table 11: Revenues generated with silicones in Eastern Europe from 2009 to 2025
Table 12: Revenues generated with silicones in Eastern Europe from 2009 to 2025 – split by product groups
Table 13: Production of silicones in Eastern Europe from 2009 to 2025 – split by major countries
Table 14: Demand for silicones in North America from 2009 to 2025 – split by major countries
Table 15: Revenues generated with silicones in North America from 2009 to 2025
Table 16: Revenues generated with silicones in North America from 2009 to 2025 – split by product groups
Table 17: Production of silicones in North America from 2009 to 2025 – split by major countries
Table 18: Demand for silicones in South America from 2009 to 2025 – split by major countries
Table 19: Revenues generated with silicones in South America from 2009 to 2025
Table 20: Revenues generated with silicones in South America from 2009 to 2025 – split by product groups
Table 21: Production of silicones in South America from 2009 to 2025 – split by major countries
Table 22: Demand for silicones in Asia-Pacific from 2009 to 2025 – split by major countries
Table 23: Revenues generated with silicones in Asia-Pacific from 2009 to 2025
Table 24: Revenues generated with silicones in Asia-Pacific from 2009 to 2025 – split by product groups
Table 25: Production of silicones in Asia-Pacific from 2009 to 2025 – split by major countries
Table 26: Revenues generated with silicones in the region Middle East & Africa from 2009 to 2025
Table 27: Revenues generated with silicones in the region Middle East & Africa from 2009 to 2025 – split by product groups
Table 28: Revenues generated with silicones in France from 2009 to 2025 in million USD and million EUR
Table 29: Revenues generated with silicones in France from 2009 to 2025 – split by applications
Table 30: Revenues generated with silicones in Germany from 2009 to 2025
Table 31: Important manufacturers of silicones in Germany
Table 32: Revenues generated with silicones in Germany from 2009 to 2025 – split by applications
Table 33: Revenues generated with silicones in Italy from 2009 to 2025
Table 34: Revenues generated with silicones in Italy from 2009 to 2025 – split by applications
Table 35: Revenues generated with silicones in Spain from 2009 to 2025
Table 36: Revenues generated with silicones in Spain from 2009 to 2025 – split by applications
Table 37: Revenues generated with silicones in the United Kingdom from 2009 to 2025
Table 38: Revenues generated with silicones in the United Kingdom from 2009 to 2025 – split by applications
Table 39: Revenues generated with silicones in Other Western Europe from 2009 to 2025
Table 40: Important manufacturers of silicones in Other Western Europe
Table 41: Demand for silicones in Other Western Europe from 2009 to 2025 – split by applications
Table 42: Revenues generated with silicones in Russia from 2009 to 2025
Table 43: Revenues generated with silicones in Russia from 2009 to 2025 – split by applications
Table 44: Revenues generated with silicones in Turkey from 2009 to 2025
Table 45: Revenues generated with silicones in Turkey from 2009 to 2025 – split by applications
Table 46: Revenues generated with silicones in Other Eastern Europe from 2009 to 2025
Table 47: Revenues generated with silicones in Other Eastern Europe from 2009 to 2025 – split by applications
Table 48: Revenues generated with silicones in Canada from 2009 to 2025
Table 49: Revenues generated with silicones in Canada from 2009 to 2025 – split by applications
Table 50: Revenues generated with silicones in Mexico from 2009 to 2025
Table 51: Revenues generated with silicones in Mexico from 2009 to 2025 – split by applications
Table 52: Revenues generated with silicones in the USA from 2009 to 2025
Table 53: Important manufacturers of silicones in the USA
Table 54: Revenues generated with silicones in the USA from 2009 to 2025 – split by applications
Table 55: Revenues generated with silicones in Brazil from 2009 to 2025
Table 56: Revenues generated with silicones in Brazil from 2009 to 2025– split by applications
Table 57: Revenues generated with silicones in Other South America from 2009 to 2025
Table 58: Revenues generated with silicones in Other South America from 2009 to 2025 – split by applications
Table 59: Revenues generated with silicones in China from 2009 to 2025
Table 60: Important manufacturers of silicones in China
Table 61: Revenues generated with silicones in China from 2009 to 2025 – split by applications
Table 62: Revenues generated with silicones in India from 2009 to 2025
Table 63: Revenues generated with silicones in India from 2009 to 2025 – split by applications
Table 64: Revenues generated with silicones in Japan from 2009 to 2025
Table 65: Important manufacturers of silicones in Japan
Table 66: Revenues generated with silicones in Japan from 2009 to 2025 – split by applications
Table 67: Revenues generated with silicones in South Korea from 2009 to 2025
Table 68: Revenues generated with silicones in South Korea from 2009 to 2025 – split by applications
Table 69: Revenues generated with silicones in Other Asia-Pacific from 2009 to 2025
Table 70: Revenues generated with silicones in Other Asia-Pacific from 2009 to 2025 – split by applications
Table 71: Global demand for silicones from 2009 to 2025 – split by applications
Table 72: Global revenues generated with silicones in the construction industry from 2009 to 2025 – split by regions
Table 73: Global demand for silicones in the construction industry from 2009 to 2025 – split by regions
Table 74: Global revenues generated with silicones in the segment electrical and electronics from 2009 to 2025 – split by regions
Table 75: Global demand for silicones in the segment electrical and electronics from 2009 to 2025 – split by regions
Table 76: Global revenues generated with silicones in the segment automotive from 2009 to 2025 – split by regions
Table 77: Global demand for silicones in the segment automotive from 2009 to 2025 – split by regions
Table 78: Global revenues generated with silicones in the segment health care and cosmetics from 2009 to 2025 – split by regions
Table 79: Global demand for silicones in the segment health care and cosmetics from 2009 to 2025 – split by regions
Table 80: Global revenues generated with silicones in other applications from 2009 to 2025 – split by regions
Table 81: Global demand for silicones in other applications from 2009 to 2025 – split by regions
Table 82: Revenues generated with silicones in Western Europe from 2009 to 2025 – split by applications
Table 83: Demand for silicones in Western Europe from 2009 to 2025 – split by applications
Table 84: Revenues generated with silicones in the construction industry in Western Europe from 2009 to 2025 – split by major countries
Table 85: Revenues generated with silicones in the segment electrical and electronics in Western Europe from 2009 to 2025 – split by major countries
Table 86: Revenues generated with silicones in the segment automotive in Western Europe from 2009 to 2025 – split by major countries
Table 87: Revenues generated with silicones in the health care and cosmetics industry in Western Europe from 2009 to 2025 – split by major countries
Table 88: Revenues generated with silicones in other applications in Western Europe from 2009 to 2025 – split by major countries
Table 89: Revenues generated with silicones in Eastern Europe from 2009 to 2025 – split by applications
Table 90: Demand for silicones in Eastern Europe from 2009 to 2025 – split by applications
Table 91: Revenues generated with silicones in the construction industry in Eastern Europe from 2009 to 2025 – split by major countries
Table 92: Revenues generated with silicones in the segment electrical and electronics in Eastern Europe from 2009 to 2025 – split by major countries
Table 93: Revenues generated with silicones in the segment automotive in Eastern Europe from 2009 to 2025 – split by major countries
Table 94: Revenues generated with silicones in the health care and cosmetics industry in Eastern Europe from 2009 to 2025 – split by major countries
Table 95: Revenues generated with silicones in other applications in Eastern Europe from 2009 to 2025 – split by major countries
Table 96: Revenues generated with silicones in North America from 2009 to 2025 in million EUR – split by applications
Table 97: Demand for silicones in North America from 2009 to 2025 – split by applications
Table 98: Revenues generated with silicones in the construction industry in North America from 2009 to 2025 – split by major countries
Table 99: Revenues generated with silicones in the segment electrical and electronics in North America from 2009 to 2025 – split by major countries
Table 100: Revenues generated with silicones in the segment automotive in North America from 2009 to 2025 – split by major countries
Table 101: Revenues generated with silicones in the health care and cosmetics industry in North America from 2009 to 2025 – split by major countries
Table 102: Revenues generated with silicones in other applications in North America from 2009 to 2025 – split by major countries
Table 103: Revenues generated with silicones in South America from 2009 to 2025 – split by applications
Table 104: Demand for silicones in South America from 2009 to 2025 – split by applications
Table 105: Revenues generated with silicones in the construction industry in South America from 2009 to 2025 – split by major countries
Table 106: Revenues generated with silicones in the segment electrical and electronics in South America from 2009 to 2025 – split by major countries
Table 107: Revenues generated with silicones in the segment automotive in South America from 2009 to 2025 – split by major countries
Table 108: Revenues generated with silicones in the health care and cosmetics industry in South America from 2009 to 2025 – split by major countries
Table 109: Revenues generated with silicones in other applications in South America from 2009 to 2025 – split by major countries
Table 110: Revenues generated with silicones in Asia-Pacific from 2009 to 2025 – split by applications
Table 111: Demand for silicones in Asia-Pacific from 2009 to 2025 – split by applications
Table 112: Revenues generated with silicones in the construction industry in Asia-Pacific from 2009 to 2025 – split by major countries
Table 113: Revenues generated with silicones in the segment electrical and electronics in Asia-Pacific from 2009 to 2025 – split by major countries
Table 114: Revenues generated with silicones in the segment automotive in Asia-Pacific from 2009 to 2025 – split by major countries
Table 115: Revenues generated with silicones in the health care and cosmetics industry in Asia-Pacific from 2009 to 2025 – split by major countries
Table 116: Revenues generated with silicones in other applications in Asia-Pacific from 2009 to 2025 – split by major countries
Table 117: Revenues generated with silicones in the Middle East and Africa from 2009 to 2025 – split by applications
Table 118: Demand for silicones in the Middle East and Africa from 2009 to 2025 – split by applications


