

Description
The Plastics Market Report – Europe is now also available in parts (e.g. individual country profiles or all manufacturer profiles). Please feel free to contact us and we will immediately send you an offer for your specific selection.
Plastics play a major role in the “Green Deal” that aims to make Europe climate-neutral by 2050. EU initiatives for circular economy and bioeconomy promote recycling and bioplastics, whereas plastic waste and microplastics are to be restricted. Further, Europe wants to become less dependent on oil and gas imports. Despite crises and conflicts, nearly 57 million tonnes of plastics were sold in Europe last year, around 3 million tonnes more than in 2015. This is the second time Ceresana has analyzed the entire European market for all commercially important plastics: from mass-produced standard polymers, such as polyethylene, polypropylene, PET or PVC, to high-performance plastics needed for lightweight construction and special technical applications.
A Growing Market for Plastics
Market researchers at Ceresana expect average sales growth of 2.0% per year for the European plastics industry. This major economic sector is thus expected to reach a volume of around EUR 107 billion in 2031. This impressive figure does not include synthetic fibers for textiles; nor does it take into account synthetic resins and silicones for paints and coatings, adhesives and sealants. In Europe, Germany is the largest producer of plastics, with a market share of almost 22%, followed by Russia, Belgium and France. Regionally, production and consumption of plastics are developing very differently. Ceresana’s new plastics market report examines the different types of plastics and their areas of application in detail.
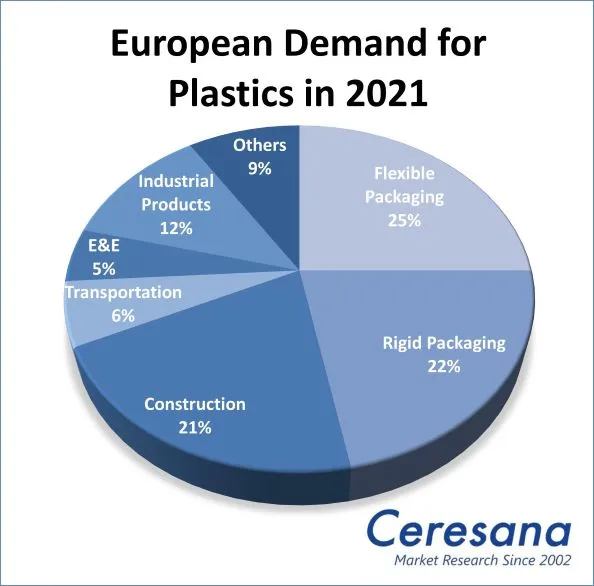
Polymers for Packaging and Construction
Packaging and construction products currently account for around 68% of total demand for plastics in Europe. The two plastic types polyethylene and polypropylene dominate the “flexible packaging” application area, i.e. films, bags and sacks. PET, on the other hand, is the main type of plastic used for “rigid packaging” in Europe, for example for bottles and lids, cans, cups and boxes. Instead of bottles, plastic bags are increasingly being used for some beverages. Compostable bioplastics are becoming increasingly competitive, especially for food packaging. In the construction industry, plastics are needed for both structural and civil engineering, for example for films, cables, pipes, profiles, dowels, coatings and membranes. Despite concerns from environmentalists, PVC is still the most widely used type of plastic in this sector. Insulation materials such as EPS help save energy.
Overview of the Study:
Chapter 1 provides a detailed presentation and analysis of the European market for plastics – including forecasts up to 2031.
The following application areas are examined in this study:
- Flexible packaging
- Rigid packaging
- Construction
- Transportation
- Electrical & electronics
- Industry
- Other applications
These plastic types are considered individually:
- Polyethylene (LDPE, LLDPE and HDPE)
- Polyvinyl Chloride (PVC)
- Polypropylene (PP)
- Polyethylene Terephthalat (PET)
- Polystyrene (PS und EPS)
- Other Plastics (polyurethane (PUR), polyamide (PA), acrylonitrile butadiene styrene (ABS), polycarbonate (PC), polymethyl methacrylate (PMMA), polyoxymethylene (POM), polybutylene terephthalate (PBT), styrene acrylonitrile (SAN), fluoropolymers and bioplastics)
Chapter 2 considers 23 countries individually: Demand, revenues, production, and import & export of plastics. Total production and trade volumes are broken down by type of plastic. The development of total demand is reported for each type of plastic and application.
Chapter 3 provides useful company profiles of the most important European manufacturers of plastics, clearly structured by contact details, revenues, profit, product range, production sites and brief profile. Detailed profiles are provided by 112 manufacturers, e.g. BASF SE, Borealis AG, Covestro AG, Braskem S.A., DuPont (E.I.) De Nemours, ExxonMobil Corp., Lanxess AG, LyondellBasell Industries N.V., The Dow Chemical Company, Total S.A., SABIC und Ineos Group, Ltd.
Scope of the Report:
Attributes | Details |
| Base Year | 2021 |
| Trend Period | 2019 – 2031 |
| Forecast Period | 2022 – 2031 |
| Pages | 520 |
| Application Areas | Flexible Packaging, Rigid Packaging, Construction, Transportation, Electrical & Electronics, Industry, Other Applications |
| Plastic Types | Polyethylene (LDPE, LLDPE and HDPE), Polyvinyl Chlorid (PVC), Polypropylene (PP), Polyethylene Terephthalat (PET), Polystyrene (PS und EPS), Other Plastics |
| Company Profiles | BASF SE, Borealis AG, Covestro AG, Braskem S.A., DuPont (E.I.) De Nemours, ExxonMobil Corp., Lanxess AG, LyondellBasell Industries N.V., The Dow Chemical Company, Total S.A., SABIC und Ineos Group, Ltd. (Selection) |
| Edition | 2nd edition |
| Publication | August 2022 |
FAQs
How will the plastics market develop in Europe up to the year 2031?
We expect average sales growth of 2.0% per year for the European plastics industry. This sector is thus expected to reach a volume of around EUR 107 billion in 2031.
Which countries have the largest market share of the production of plastics?
Germany is the largest producer of plastics, with a market share of almost 22%, followed by Russia, Belgium and France.
Which application areas account for the highest use of plastics?
With a share of 68% of total demand for plastics in Europe, packaging and construction products represent the largest application areas.
1 Market Data
1.1 Europe
1.1.1 Demand
1.1.2 Revenues
1.1.3 Production
1.1.4 Applications
1.1.4.1 Flexible Packaging
1.1.4.2 Rigid Packaging
1.1.4.3 Construction Industry
1.1.4.4 Transportation
1.1.4.5 Electrical and Electronics
1.1.4.6 Industrial Products
1.1.4.7 Other Applications
1.1.5 Products
1.1.5.1 Polyethylene – LDPE
1.1.5.2 Polyethylene – LLDPE
1.1.5.3 Polyethylene – HDPE
1.1.5.4 Polypropylene (PP)
1.1.5.5 Polyvinyl Chloride (PVC)
1.1.5.6 Polyethylene Terephthalate (PET)
1.1.5.7 Polystyrene (PS & EPS)
1.1.5.8 Other Plastics
2 Market Data: Countries
2.1 Europe
2.1.1 Austria
2.1.1.1 Demand and Revenues
2.1.1.2 Production and Trade
2.1.2 Belgium
2.1.2.1 Demand and Revenues
2.1.2.2 Production and Trade
2.1.3 Bulgaria
2.1.3.1 Demand and Revenues
2.1.3.2 Production and Trade
2.1.4 Czechia
2.1.4.1 Demand and Revenues
2.1.4.2 Production and Trade
2.1.5 Denmark
2.1.6 Finland
2.1.6.1 Demand and Revenues
2.1.6.2 Production and Trade
2.1.7 France
2.1.7.1 Demand and Revenues
2.1.7.2 Production and Trade
2.1.8 Germany
2.1.8.1 Demand and Revenues
2.1.8.2 Production and Trade
2.1.9 Greece
2.1.9.1 Demand and Revenues
2.1.9.2 Production and Trade
2.1.10 Hungary
2.1.10.1 Demand and Revenues
2.1.10.2 Production and Trade
2.1.11 Italy
2.1.11.1 Demand and Revenues
2.1.11.2 Production and Trade
2.1.12 Norway
2.1.12.1 Demand and Revenues
2.1.12.2 Production and Trade
2.1.13 Poland
2.1.13.1 Demand and Revenues
2.1.13.2 Production and Trade
2.1.14 Portugal
2.1.14.1 Demand and Revenues
2.1.14.2 Production and Trade
2.1.15 Romania
2.1.15.1 Demand and Revenues
2.1.15.2 Production and Trade
2.1.16 Russia
2.1.16.1 Demand and Revenues
2.1.16.2 Production and Trade
2.1.17 Slovakia
2.1.17.1 Demand and Revenues
2.1.17.2 Production and Trade
2.1.18 Spain
2.1.18.1 Demand and Revenues
2.1.18.2 Production and Trade
2.1.19 Sweden
2.1.19.1 Demand and Revenues
2.1.19.2 Production and Trade
2.1.20 Switzerland
2.1.21 The Netherlands
2.1.21.1 Demand and Revenues
2.1.21.2 Production and Trade
2.1.22 Turkey
2.1.22.1 Demand and Revenues
2.1.22.2 Production and Trade
2.1.23 United Kingdom
2.1.23.1 Demand and Revenues
2.1.23.2 Production and Trade
2.1.24 Rest of Europe
2.1.24.1 Demand and Revenues
2.1.24.2 Production and Trade
3 Company Profiles*
Austria (2 Producers)
Belarus (2)
Belgium (7)
Cyprus (1)
France (6)
Germany (20)
Greece (2)
Hungary (2)
Italy (8)
Luxembourg (1)
Norway (2)
Poland (3)
Portugal (1)
Romania (1)
Russia (14)
Serbia (1)
Slovakia (1)
Spain (8)
Switzerland (4)
The Netherlands (13)
Turkey (7)
Ukraine (2)
United Kingdom (4)
*Note: The profiles are assigned to the country in which the company or holding is headquartered. Profiles also include JVs and subsidiaries.
Graph 1: European demand for plastics from 2019 to 2031
Graph 2: Revenues generated with plastics in Europe from 2019 to 2031 in billion USD and billion EUR
Graph 3: Production of plastics across Europe from 2019 to 2031
Graph 4: Demand for plastics in Austria from 2019 to 2031
Graph 5: Production of plastics in Austria from 2019 to 2031
Graph 6: Demand for plastics in Belgium from 2019 to 2031
Graph 7: Production of plastics in Belgium from 2019 to 2031
Graph 8: Demand for plastics in Bulgaria from 2019 to 2031
Graph 9: Production of plastics in Bulgaria from 2019 to 2031
Graph 10: Demand for plastics in Czechia from 2019 to 2031
Graph 11: Production of plastics in Czechia from 2019 to 2031
Graph 12: Demand for plastics in Denmark from 2019 to 2031
Graph 13: Demand for plastics in Finland from 2019 to 2031
Graph 14: Production of plastics in Finland from 2019 to 2031
Graph 15: Demand for plastics in France from 2019 to 2031
Graph 16: Production of plastics in France from 2019 to 2031
Graph 17: Demand for plastics in Germany from 2019 to 2031
Graph 18: Production of plastics in Germany from 2019 to 2031
Graph 19: Demand for plastics in Greece from 2019 to 2031
Graph 20: Production of plastics in Greece from 2019 to 2031
Graph 21: Demand for plastics in Hungary from 2019 to 2031
Graph 22: Production of plastics in Hungary from 2019 to 2031
Graph 23: Demand for plastics in Italy from 2019 to 2031
Graph 24: Production of plastics in Italy from 2019 to 2031
Graph 25: Demand for plastics in Norway from 2019 to 2031
Graph 26: Production of plastics in Norway from 2019 to 2031
Graph 27: Demand for plastics in Poland from 2019 to 2031
Graph 28: Production of plastics in Poland from 2019 to 2031
Graph 29: Demand for plastics in Portugal from 2019 to 2031
Graph 30: Production of plastics in Portugal from 2019 to 2031
Graph 31: Demand for plastics in Romania from 2019 to 2031
Graph 32: Production of plastics in Romania from 2019 to 2031
Graph 33: Demand for plastics in Russia from 2019 to 2031
Graph 34: Production of plastics in Russia from 2019 to 2031
Graph 35: Demand for plastics in Slovakia from 2019 to 2031
Graph 36: Production of plastics in Slovakia from 2019 to 2031
Graph 37: Demand for plastics in Spain from 2019 to 2031
Graph 38: Production of plastics in Spain from 2019 to 2031
Graph 39: Demand for plastics in Sweden from 2019 to 2031
Graph 40: Production of plastics in Sweden from 2019 to 2031
Graph 41: Demand for plastics in Switzerland from 2019 to 2031
Graph 42: Demand for plastics in the Netherlands from 2019 to 2031
Graph 43: Production of plastics in the Netherlands from 2019 to 2031
Graph 44: Demand for plastics in Turkey from 2019 to 2031
Graph 45: Production of plastics in Turkey from 2019 to 2031
Graph 46: Demand for plastics in the United Kingdom from 2019 to 2031
Graph 47: Production of plastics in the United Kingdom from 2019 to 2031
Graph 48: Demand for plastics in the rest of Europe from 2019 to 2031
Graph 49: Production of plastics in the rest of Europe from 2019 to 2031
Table 1: European demand for plastics from 2019 to 2031 – split by countries
Table 2: Revenues generated with plastics in Europe from 2019 to 2031 in billion USD and billion EUR
Table 3: Revenues generated with plastics in Europe in billion EUR from 2019 to 2031 – split by countries
Table 4: European production of plastics from 2019 to 2031 – split by countries
Table 5: European demand for plastics from 2019 to 2031 – split by applications
Table 6: European demand for plastics in the segment flexible packaging from 2019 to 2031 – split by countries
Table 7: European demand for plastics in the segment flexible packaging from 2019 to 2031 – split by products
Table 8: European demand for plastics in the segment rigid packaging from 2019 to 2031 – split by countries
Table 9: European demand for plastics in the segment rigid packaging from 2019 to 2031 – split by products
Table 10: European demand for plastics in the segment construction from 2019 to 2031 – split by countries
Table 11: European demand for plastics in the segment construction from 2019 to 2031 – split by products
Table 12: European demand for plastics in the segment transportation from 2019 to 2031 – split by countries
Table 13: European demand for plastics in the segment transportation from 2019 to 2031 – split by products
Table 14: European demand for plastics in the segment electrical and electronics from 2019 to 2031 – split by countries
Table 15: European demand for plastics in the segment electrical and electronics from 2019 to 2031 – split by products
Table 16: European demand for plastics in the segment industry from 2019 to 2031 – split by countries
Table 17: European demand for plastics in the segment industry from 2019 to 2031 – split by products
Table 18: European demand for plastics in the segment other applications from 2019 to 2031 – split by countries
Table 19: European demand for plastics in the segment other applications from 2019 to 2031 – split by products
Table 20: European demand for plastics from 2019 to 2031 – split by products
Table 21: European demand for LDPE from 2019 to 2031 – split by countries
Table 22: European demand for LLDPE from 2019 to 2031 – split by countries
Table 23: European demand for HDPE from 2019 to 2031 – split by countries
Table 24: European demand for PP from 2019 to 2031 – split by countries
Table 25: European demand for PVC from 2019 to 2031 – split by countries
Table 26: European demand for PET from 2019 to 2031 – split by countries
Table 27: European demand for PS & EPS from 2019 to 2031 – split by countries
Table 28: European demand for other plastics from 2019 to 2031 – split by countries
Table 29: Revenues generated with plastics in Austria from 2019 to 2031 in million USD and million EUR
Table 30: Demand for plastics in Austria from 2019 to 2031 – split by applications
Table 31: Demand for plastics in Austria from 2019 to 2031 – split by products
Table 32: Production, import, and export of and demand for plastics in Austria from 2019 to 2031
Table 33: Import of plastics in Austria from 2019 to 2031 – split by products
Table 34: Export of plastics in Austria from 2019 to 2031 – split by products
Table 35: Production of plastics in Austria from 2019 to 2031 – split by products
Table 36: Revenues generated with plastics in Belgium from 2019 to 2031 in million USD and million EUR
Table 37: Demand for plastics in Belgium from 2019 to 2031 – split by applications
Table 38: Demand for plastics in Belgium from 2019 to 2031 – split by products
Table 39: Demand for plastics in the segment flexible packaging in Belgium from 2019 to 2031 – split by products
Table 40: Demand for plastics in the segment rigid packaging in Belgium from 2019 to 2031 – split by products
Table 41: Demand for plastics in the construction segment in Belgium from 2019 to 2031 – split by products
Table 42: Demand for plastics in the transportation segment in Belgium from 2019 to 2031 – split by products
Table 43: Demand for plastics in the E&E segment in Belgium from 2019 to 2031 – split by products
Table 44: Demand for plastics in the industry segment in Belgium from 2019 to 2031 – split by products
Table 45: Demand for plastics in the segment others in Belgium from 2019 to 2031 – split by products
Table 46: Production, import, and export of and demand for plastics in Belgium from 2019 to 2031
Table 47: Import of plastics in Belgium from 2019 to 2031 – split by products
Table 48: Export of plastics in Belgium from 2019 to 2031 – split by products
Table 49: Production of plastics in Belgium from 2019 to 2031 – split by products
Table 50: Revenues generated with plastics in Bulgaria from 2019 to 2031 in million USD and million EUR
Table 51: Demand for plastics in Bulgaria from 2019 to 2031 – split by applications
Table 52: Demand for plastics in Bulgaria from 2019 to 2031 – split by products
Table 53: Import of plastics in Bulgaria from 2019 to 2031 – split by products
Table 54: Production, import, and export of and demand for plastics in Bulgaria from 2019 to 2031
Table 55: Export of plastics in Bulgaria from 2019 to 2031 – split by products
Table 56: Revenues generated with plastics in Czechia from 2019 to 2031 in million USD and million EUR
Table 57: Demand for plastics in Czechia from 2019 to 2031 – split by applications
Table 58: Demand for plastics in Czechia from 2019 to 2031 – split by products
Table 59: Import of plastics in Czechia from 2019 to 2031 – split by products
Table 60: Production, import, and export of and demand for plastics in Czechia from 2019 to 2031
Table 61: Export of plastics in Czechia from 2019 to 2031 – split by products
Table 62: Production of plastics in Czechia from 2018 to 2030 – split by products
Table 63: Revenues generated with plastics in Denmark from 2019 to 2031 in million USD and million EUR
Table 64: Demand for plastics in Denmark from 2019 to 2031 – split by applications
Table 65: Demand for plastics in Denmark from 2019 to 2031 – split by products
Table 66: Revenues generated with plastics in Finland from 2019 to 2031 in million USD and million EUR
Table 67: Demand for plastics in Finland from 2019 to 2031 – split by applications
Table 68: Demand for plastics in Finland from 2019 to 2031 – split by products
Table 69: Import of plastics in Finland from 2019 to 2031 – split by products
Table 70: Production, import, and export of and demand for plastics in Finland from 2019 to 2031
Table 71: Export of plastics in Finland from 2019 to 2031 – split by products
Table 72: Production of plastics in Finland from 2019 to 2031 – split by products
Table 73: Revenues generated with plastics in France from 2019 to 2031 in million USD and million EUR
Table 74: Demand for plastics in France from 2019 to 2031 – split by applications
Table 75: Demand for plastics in France from 2019 to 2031 – split by products
Table 76: Demand for plastics in the segment flexible packaging in France from 2019 to 2031 – split by products
Table 77: Demand for plastics in the segment rigid packaging in France from 2019 to 2031 – split by products
Table 78: Demand for plastics in the construction segment in France from 2019 to 2031 – split by products
Table 79: Demand for plastics in the transportation segment in France from 2019 to 2031 – split by products
Table 80: Demand for plastics in the segment E&E in France from 2019 to 2031 – split by products
Table 81: Demand for plastics in the industry segment in France from 2019 to 2031 – split by products
Table 82: Demand for plastics in the segment others in France from 2019 to 2031 – split by products
Table 83: Production, import, and export of and demand for plastics in France from 2019 to 2031
Table 84: Import of plastics in France from 2019 to 2031 – split by products
Table 85: Export of plastics in France from 2019 to 2031 – split by products
Table 86: Production of plastics in France from 2019 to 2031 – split by products
Table 87: Revenues generated with plastics in Germany from 2019 to 2031 in million USD and million EUR
Table 88: Demand for plastics in Germany from 2019 to 2031 – split by applications
Table 89: Demand for plastics in Germany from 2019 to 2031 – split by products
Table 90: Demand for plastics in the segment flexible packaging in Germany from 2019 to 2031 – split by products
Table 91: Demand for plastics in the segment rigid packaging in Germany from 2019 to 2031 – split by products
Table 92: Demand for plastics in the construction segment in Germany from 2019 to 2031 – split by products
Table 93: Demand for plastics in the transportation segment in Germany from 2019 to 2031 – split by products
Table 94: Demand for plastics in the segment E&E in Germany from 2019 to 2031 – split by products
Table 95: Demand for plastics in the industry segment in Germany from 2019 to 2031 – split by products
Table 96: Demand for plastics in the segment others in Germany from 2019 to 2031 – split by products
Table 97: Production, import, and export of and demand for plastics in Germany from 2019 to 2031
Table 98: Import of plastics in Germany from 2019 to 2031 – split by products
Table 99: Export of plastics in Germany from 2019 to 2031 – split by products
Table 100: Production of plastics in Germany from 2018 to 2030 – split by products
Table 101: Revenues generated with plastics in Greece from 2019 to 2031 in million USD and million EUR
Table 102: Demand for plastics in Greece from 2019 to 2031 – split by applications
Table 103: Demand for plastics in Greece from 2019 to 2031 – split by products
Table 104: Import of plastics in Greece from 2019 to 2031 – split by products
Table 105: Export of plastics in Greece from 2019 to 2031 – split by products
Table 106: Production of plastics in Greece from 2019 to 2031 – split by products
Table 107: Production, import, and export of and demand for plastics in Greece from 2019 to 2031
Table 108: Revenues generated with plastics in Hungary from 2019 to 2031 in million USD and million EUR
Table 109: Demand for plastics in Hungary from 2019 to 2031 – split by applications
Table 110: Demand for plastics in Hungary from 2019 to 2031 – split by products
Table 111: Import of plastics in Hungary from 2019 to 2031 – split by products
Table 112: Production, import, and export of and demand for plastics in Hungary from 2019 to 2031
Table 113: Export of plastics in Hungary from 2019 to 2031 – split by products
Table 114: Production of plastics in Hungary from 2019 to 2031 – split by products
Table 115: Revenues generated with plastics in Italy from 2019 to 2031 in million USD and million EUR
Table 116: Demand for plastics in Italy from 2019 to 2031 – split by applications
Table 117: Demand for plastics in Italy from 2019 to 2031 – split by products
Table 118: Demand for plastics in the segment flexible packaging in Italy from 2019 to 2031 – split by products
Table 119: Demand for plastics in the segment rigid packaging in Italy from 2019 to 2031 – split by products
Table 120: Demand for plastics in the construction segment in Italy from 2019 to 2031 – split by products
Table 121: Demand for plastics in the transportation segment in Italy from 2019 to 2031 – split by products
Table 122: Demand for plastics in the E&E segment in Italy from 2019 to 2031 – split by products
Table 123: Demand for plastics in the industry segment in Italy from 2019 to 2031 – split by products
Table 124: Demand for plastics in the segment others in Italy from 2019 to 2031 – split by products
Table 125: Production, import, and export of and demand for plastics in Italy from 2019 to 2031
Table 126: Import of plastics in Italy from 2019 to 2031 – split by products
Table 127: Export of plastics in Italy from 2019 to 2031 – split by products
Table 128: Production of plastics in Italy from 2019 to 2031 – split by products
Table 129: Revenues generated with plastics in Norway from 2019 to 2031 in million USD and million EUR
Table 130: Demand for plastics in Norway from 2019 to 2031 – split by applications
Table 131: Demand for plastics in Norway from 2019 to 2031 – split by products
Table 132: Import of plastics in Norway from 2019 to 2031 – split by products
Table 133: Production, import, and export of and demand for plastics in Norway from 2019 to 2031
Table 134: Export of plastics in Norway from 2019 to 2031 – split by products
Table 135: Production of plastics in Norway from 2019 to 2031 – split by products
Table 136: Revenues generated with plastics in Poland from 2019 to 2031 in million USD and million EUR
Table 137: Demand for plastics in Poland from 2019 to 2031 – split by applications
Table 138: Demand for plastics in Poland from 2019 to 2031 – split by products
Table 139: Demand for plastics in the segment flexible packaging in Poland from 2019 to 2031 – split by products
Table 140: Demand for plastics in the segment rigid packaging in Poland from 2019 to 2031 – split by products
Table 141: Demand for plastics in the construction segment in Poland from 2019 to 2031 – split by products
Table 142: Demand for plastics in the transportation segment in Poland from 2019 to 2031 – split by products
Table 143: Demand for plastics in the E&E segment in Poland from 2019 to 2031 – split by products
Table 144: Demand for plastics in the industry segment in Poland from 2019 to 2031 – split by products
Table 145: Demand for plastics in the segment others in Poland from 2019 to 2031 – split by products
Table 146: Production, import, and export of and demand for plastics in Poland from 2019 to 2031
Table 147: Import of plastics in Poland from 2019 to 2031 – split by products
Table 148: Export of plastics in Poland from 2019 to 2031 – split by products
Table 149: Production of plastics in Poland from 2019 to 2031 – split by products
Table 150: Revenues generated with plastics in Portugal from 2019 to 2031 in million USD and million EUR
Table 151: Demand for plastics in Portugal from 2019 to 2031 – split by applications
Table 152: Demand for plastics in Portugal from 2019 to 2031 – split by products
Table 153: Production, import, and export of and demand for plastics in Portugal from 2019 to 2031
Table 154: Import of plastics in Portugal from 2019 to 2031 – split by products
Table 155: Export of plastics in Portugal from 2019 to 2031 – split by products
Table 156: Production of plastics in Portugal from 2019 to 2031 – split by products
Table 157: Revenues generated with plastics in Romania from 2019 to 2031 in million USD and million EUR
Table 158: Demand for plastics in Romania from 2019 to 2031 – split by applications
Table 159: Demand for plastics in Romania from 2019 to 2031 – split by products
Table 160: Import of plastics in Romania from 2019 to 2031 – split by products
Table 161: Production, import, and export of and demand for plastics in Romania from 2019 to 2031
Table 162: Export of plastics in Romania from 2019 to 2031 – split by products
Table 163: Production of plastics in Romania from 2019 to 2031 – split by products
Table 164: Revenues generated with plastics in Russia from 2019 to 2031 in million USD and million EUR
Table 165: Demand for plastics in Russia from 2019 to 2031 – split by applications
Table 166: Demand for plastics in Russia from 2019 to 2031 – split by products
Table 167: Demand for plastics in the segment flexible packaging in Russia from 2019 to 2031 – split by products
Table 168: Demand for plastics in the segment rigid packaging in Russia from 2019 to 2031 – split by products
Table 169: Demand for plastics in the construction segment in Russia from 2019 to 2031 – split by products
Table 170: Demand for plastics in the transportation segment in Russia from 2019 to 2031 – split by products
Table 171: Demand for plastics in the E&E segment in Russia from 2019 to 2031 – split by products
Table 172: Demand for plastics in the industry segment in Russia from 2019 to 2031 – split by products
Table 173: Demand for plastics in the segment others in Russia from 2019 to 2031 – split by products
Table 174: Production, import, and export of and demand for plastics in Russia from 2019 to 2031
Table 175: Import of plastics in Russia from 2019 to 2031 – split by products
Table 176: Export of plastics in Russia from 2019 to 2031 – split by products
Table 177: Production of plastics in Russia from 2019 to 2031 – split by products
Table 178: Revenues generated with plastics in Slovakia from 2019 to 2031 in million USD and million EUR
Table 179: Demand for plastics in Slovakia from 2019 to 2031 – split by applications
Table 180: Demand for plastics in Slovakia from 2019 to 2031 – split by products
Table 181: Import of plastics in Slovakia from 2019 to 2031 – split by products
Table 182: Production, import, and export of and demand for plastics in Slovakia from 2019 to 2031
Table 183: Export of plastics in Slovakia from 2019 to 2031 – split by products
Table 184: Production of plastics in Slovakia from 2019 to 2031 – split by products
Table 185: Revenues generated with plastics in Spain from 2019 to 2031 in million USD and million EUR
Table 186: Demand for plastics in Spain from 2019 to 2031 – split by applications
Table 187: Demand for plastics in Spain from 2019 to 2031 – split by products
Table 188: Demand for plastics in the segment flexible packaging in Spain from 2019 to 2031 – split by products
Table 189: Demand for plastics in the segment rigid packaging in Spain from 2019 to 2031 – split by products
Table 190: Demand for plastics in the construction segment in Spain from 2019 to 2031 – split by products
Table 191: Demand for plastics in the transportation segment in Spain from 2019 to 2031 – split by products
Table 192: Demand for plastics in the E&E segment in Spain from 2019 to 2031 – split by products
Table 193: Demand for plastics in the industry segment in Spain from 2019 to 2031 – split by products
Table 194: Demand for plastics in the segment others in Spain from 2019 to 2031 – split by products
Table 195: Production, import, and export of and demand for plastics in Spain from 2019 to 2031
Table 196: Import of plastics in Spain from 2019 to 2031 – split by products
Table 197: Export of plastics in Spain from 2019 to 2031 – split by products
Table 198: Production of plastics in Spain from 2019 to 2031 – split by products
Table 199: Revenues generated with plastics in Sweden from 2019 to 2031 in million USD and million EUR
Table 200: Demand for plastics in Sweden from 2019 to 2031 – split by applications
Table 201: Demand for plastics in Sweden from 2019 to 2031 – split by products
Table 202: Import of plastics in Sweden from 2019 to 2031 – split by products
Table 203: Production, import, and export of and demand for plastics in Sweden from 2019 to 2031
Table 204: Export of plastics in Sweden from 2019 to 2031 – split by products
Table 205: Production of plastics in Sweden from 2018 to 2030 – split by products
Table 206: Revenues generated with plastics in Switzerland from 2019 to 2031 in million USD and million EUR
Table 207: Demand for plastics in Switzerland from 2019 to 2031 – split by applications
Table 208: Demand for plastics in Switzerland from 2019 to 2031 – split by products
Table 209: Demand for plastics in the Netherlands from 2019 to 2031 – split by applications
Table 210: Demand for plastics in the Netherlands from 2019 to 2031 – split by products
Table 211: Revenues generated with plastics in the Netherlands from 2019 to 2031 in million USD and million EUR
Table 212: Demand for plastics in the segment flexible packaging in the Netherlands from 2019 to 2031 – split by products
Table 213: Demand for plastics in the segment rigid packaging in the Netherlands from 2019 to 2031 – split by products
Table 214: Demand for plastics in the construction segment in the Netherlands from 2019 to 2031 – split by products
Table 215: Demand for plastics in the transportation segment in the Netherlands from 2019 to 2031 – split by products
Table 216: Demand for plastics in the E&E segment in the Netherlands from 2019 to 2031 – split by products
Table 217: Demand for plastics in the industry segment in the Netherlands from 2019 to 2031 – split by products
Table 218: Demand for plastics in the segment others in the Netherlands from 2019 to 2031 – split by products
Table 219: Production, import, and export of and demand for plastics in the Netherlands from 2019 to 2031
Table 220: Import of plastics in the Netherlands from 2019 to 2031 – split by products
Table 221: Export of plastics in the Netherlands from 2019 to 2031 – split by products
Table 222: Production of plastics in the Netherlands from 2019 to 2031 – split by products
Table 223: Revenues generated with plastics in Turkey from 2019 to 2031 in million USD and million EUR
Table 224: Demand for plastics in Turkey from 2019 to 2031 – split by applications
Table 225: Demand for plastics in Turkey from 2019 to 2031 – split by products
Table 226: Demand for plastics in the segment flexible packaging in Turkey from 2019 to 2031 – split by products
Table 227: Demand for plastics in the segment rigid packaging in Turkey from 2019 to 2031 – split by products
Table 228: Demand for plastics in the construction segment in Turkey from 2019 to 2031 – split by products
Table 229: Demand for plastics in the transportation segment in Turkey from 2019 to 2031 – split by products
Table 230: Demand for plastics in the E&E segment in Turkey from 2019 to 2031 – split by products
Table 231: Demand for plastics in the industry segment in Turkey from 2019 to 2031 – split by products
Table 232: Demand for plastics in the segment others in Turkey from 2019 to 2031 – split by products
Table 233: Production, import, and export of and demand for plastics in Turkey from 2019 to 2031
Table 234: Import of plastics in Turkey from 2019 to 2031 – split by products
Table 235: Export of plastics in Turkey from 2019 to 2031 – split by products
Table 236: Production of plastics in Turkey from 2019 to 2031 – split by products
Table 237: Revenues generated with plastics in the United Kingdom from 2019 to 2031 in million USD and million EUR
Table 238: Demand for plastics in the United Kingdom from 2019 to 2031 – split by applications
Table 239: Demand for plastics in the United Kingdom from 2019 to 2031 – split by products
Table 240: Demand for plastics in the segment flexible packaging in the United Kingdom from 2019 to 2031 – split by products
Table 241: Demand for plastics in the segment rigid packaging in the United Kingdom from 2019 to 2031 – split by products
Table 242: Demand for plastics in the construction segment in the United Kingdom from 2019 to 2031 – split by products
Table 243: Demand for plastics in the transportation segment in the United Kingdom from 2019 to 2031 – split by products
Table 244: Demand for plastics in the E&E segment in the United Kingdom from 2019 to 2031 – split by products
Table 245: Demand for plastics in the industry segment in the United Kingdom from 2019 to 2031 – split by products
Table 246: Demand for plastics in the segment others in the United Kingdom from 2019 to 2031 – split by products
Table 247: Production, import, and export of and demand for plastics in the United Kingdom from 2019 to 2031
Table 248: Import of plastics in the United Kingdom from 2019 to 2031 – split by products
Table 249: Export of plastics in the United Kingdom from 2019 to 2031 – split by products
Table 250: Production of plastics in the United Kingdom from 2019 to 2031 – split by products
Table 251: Demand for plastics in the rest of Europe from 2019 to 2031 – split by applications
Table 252: Demand for plastics in the rest of Europe from 2019 to 2031 – split by products
Table 253: Revenues generated with plastics in the remaining countries of Europe from 2019 to 2031 in million USD and million EUR
Table 254: Production, import, and export of and demand for plastics in the remaining European countries from 2019 to 2031
Table 255: Production of plastics in the rest of Europe from 2019 to 2031 – split by products


