

Description
The Bioplastics Market Report is now also available in parts (e.g. individual country profiles or all manufacturer profiles). Please feel free to contact us and we will immediately send you an offer for your specific selection.
Will there soon be more plastics than stones? The triumph of polymers is unstoppable: The world’s plastic consumption doubles approximately every 20 years; in the emerging markets of Africa and Asia, it is even expected to triple. Bioplastics are benefiting from this boom: There are “green” alternatives to plastics made from crude oil or natural gas for an increasing number of applications. To reduce the ecological footprint, even petrochemical products are increasingly being mixed with biomass. The latest and already ninth edition of Ceresana’s bioplastics market report anticipates further growth: Market researchers forecast that the global bio-based and biodegradable plastic market size will reach around USD 12 billion by 2034.
The bioplastics market report primarily analyzes the global market for thermoplastics made from renewable raw materials that are biodegradable i.e. can be decomposed by microorganisms in nature or at least composted in industrial plants. PHA from sugar and TPS from starch, for example, are bio-based and biodegradable. However, there are also plastics made from biogenic raw materials that are not compostable, such as PEF made from fructose or bio-polyethylene based on sugar cane. The market study also covers petrochemical, biodegradable plastics such as polycaprolactone (PCL), polybutylene adipate terephthalate (PBAT), or polybutylene succinate (PBS). This study does not cover biobased elastomers, thermosets, natural fiber-reinforced plastics (NFRP) as well as composites such as wood-plastic composites (WPC).
Compost Soil Instead of Waste Crisis
The environmental impact of this ubiquitous wonder material is a challenge. Even in comparatively environmentally conscious Europe, the majority of the around 42.5 million tonnes of plastic waste generated there each year is still incinerated or landfilled – only around 20% is recycled. According to a new report by the EU’s Joint Research Centre (JRC), around 3.7 million tons of plastic waste are “lost in the environment” in Europe every year, mainly due to littering, mismanagement, and textile washing: Almost 6% of all European plastic consumption ends up in the ground or water. To remedy this, the EU researchers recommend more recycling – but also more bioplastics. The new EU packaging regulation (PPWR) now stipulates for the first time that all packaging must soon be reusable or recyclable, and in certain cases also compostable. The EU Commission is working on binding quotas for the use of bio-based raw materials. The industry is eagerly awaiting the new “EU Bioeconomy Strategy”, which is planned for the end of 2025, and the “Circular Economy Act”, which is due in 2026. To date, however, most biopolymer materials have not been produced in Europe, but in Asia-Pacific. Ceresana expects this region of the world, which has sugar cane and other low-cost biomass raw materials at its disposal, to see the highest growth in the coming years. In addition to market data and forecasts, the study also contains information on the regulatory framework as well as on the general economic environment and the situation in the packaging industry (including key companies, market size, recycling rates) in each country.
Innovations for Sustainable Applications
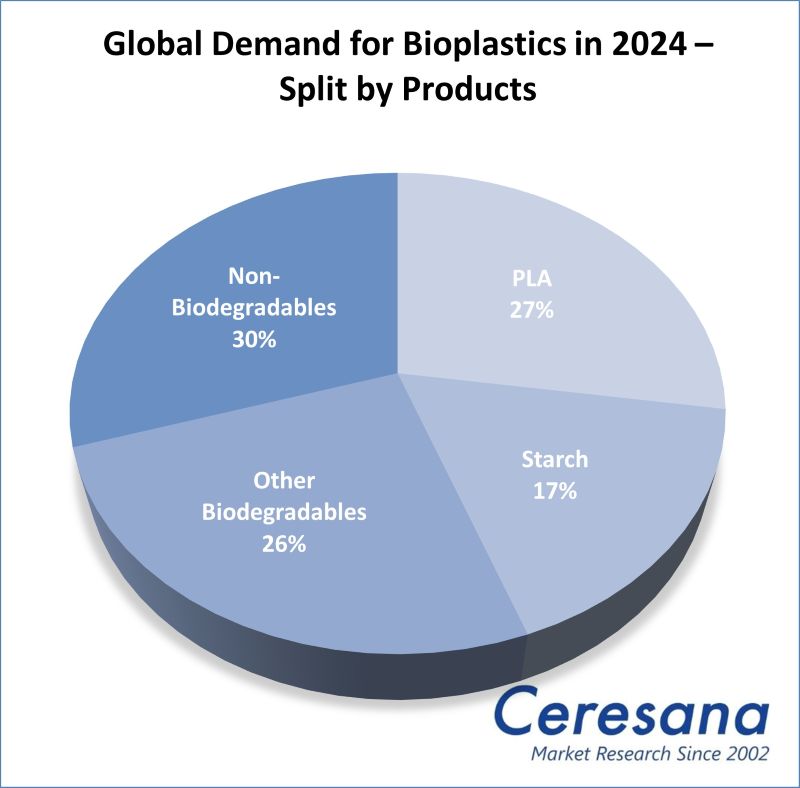
The packaging industry is the largest consumer of plastics today. The advantages of the following bioplastics, which are currently by far the best-selling materials, are particularly evident in flexible packaging: Polylactic acids (PLA) and starch polymers (especially TPS) offer higher permeability, biodegradability, and a good “green” image among consumers. For the starch-based bioplastics and polylactic acid market, Ceresana’s latest market report expects further volume growth of 7.7% per year until 2034. For bio-based but non-biodegradable plastics, such as bio-polyethylene, bio-PET, or bio-PA, growth is expected to be lower at 5.3% per year. Like conventional petrochemical plastics, the various polymers made from biogenic raw materials each have areas of application for which they are particularly well suited. Biocompatibility, for example, is an advantage for medical implants. Compostability is required for agricultural films and flower pots. In 3D printing, bio-filaments are valued not least because they do not smell of burnt plastic. The analysts at Ceresana are currently registering the highest growth rates for innovative bioplastics in the automotive and electronics sectors.
Current Global Bioplastics Market Report:
Chapter 1 of the new market study provides a comprehensive presentation and analysis of the global bioplastics market with forecasts up to 2034: The development of demand (in tonnes), revenues (in USD and EUR), and production (in tonnes) is shown for each region.
In addition, these bioplastic applications are examined individually:
- Rigid packaging
- Flexible packaging (bags, sacks, pouches)
- Other flexible packaging
- Consumer goods
- Automotive and electronics
- Other applications
For the regions Europe, North America, Asia-Pacific and “rest of the world”, the bioplastic production is broken down into the following product groups:
- Polylactic acid (PLA)
- Starch
- Other biodegradable plastics
- Non-biodegradable plastics.
The demand for bioplastics per region is broken down for these different types of plastic:
- Polylactic acid (PLA)
- Starch-based plastics
- Polyhydroxyalkanoates (PHA)
- Polybutylene adipate terephthalate (PBAT)
- Other biodegradable plastics
- Bio-polyethylene (Bio-PE)
- Other non-biodegradable plastics
In Chapter 2, the 11 most important sales markets are examined individually: France, Germany, Italy, Spain, the Netherlands, United Kingdom, USA, China, Japan, South Korea, and Taiwan. The following are shown in each case: Demand and revenues, demand in the individual application areas, and demand per product type (PLA, starch, other biodegradable plastics, non-biodegradable bio-based plastics).
To give an overview of the bioplastic industry, chapter 3 provides useful company profiles of the largest bioplastic manufacturers, clearly arranged according to contact details, revenues, net income, product range, production sites, and profile summary. Detailed profiles of 60 bioplastic manufacturers are supplied, such as BASF SE, Evonik Industries AG, Cargill, Eastman Chemical Company, Far Eastern New Century Corporation (FENC), Hengli Group, Mitsubishi Chemical Group Corporation, PTT Global Chemical Public Company Limited (GC), and TotalEnergies SE.
=> Ceresana regularly analyzes the European and global markets for plastics, plastic additives, and plastic products. Individual types of plastic such as PLA are just as much a topic for in-depth Ceresana studies as, for example, plastic pipes or bioplastic films. Current Ceresana market studies are available on various packaging materials, such as plastic closures, plastic containers, flexible and rigid plastic packaging, and also on possible alternatives to plastics such as metal, corrugated board, or cardboard. A particular focus of Ceresana’s market research is on bio-based products. For example, new studies deal with adhesives, surfactants, and solvents made from renewable raw materials. Ceresana also organizes online events on the bio-economy, for example on bioplastics and bio-based packaging.
Scope of the Report:
Attributes | Details |
Base Year | 2024 |
Trend Period | 2022 – 2034 |
Forecast Period | 2025 – 2034 |
Pages | 260 |
Application Areas | Rigid packaging, flexible packaging (bags, sacks, pouches), other flexible packaging, consumer goods, automotive and electronics, other applications |
Demand per Type of Bioplastics | Polylactic acid (PLA), starch-based plastics, polyhydroxyalkanoates (PHA), polybutylene adipate terephthalate (PBAT), other biodegradable plastics, bio-polyethylene (Bio-PE), other non-biodegradable plastics |
Company Profiles | BASF, Evonik, Cargill, Eastman, FENC, Hengli, Mitsubishi Chemical, PTT GC, and TotalEnergies (Selection) |
Edition | 9th edition |
Publication | September 2025 |
FAQs
How will bioplastics sales develop by 2034?
Analysts expect revenues generated with bioplastics to rise to approx. USD 12.0 billion by 2034.
What application area is expected to experience the highest growth?
The highest growth rates over the next few years are expected in the automotive and electronics segment.
Which types of bioplastics are showing the highest growth rates?
For the starch-based bioplastics and polylactic acid market, Ceresana expects further volume growth of 7.7% per year until 2034.
1 Market Data: World and Regions
1.1 World
1.1.1 Basics
1.1.2 Demand
1.1.3 Revenues
1.1.4 Production
1.1.5 Application Areas
1.1.5.1 Rigid Packaging
1.1.5.2 Flexible Packaging – Bags
1.1.5.3 Flexible Packaging – Others
1.1.5.4 Consumer Goods
1.1.5.5 Automotive and Electronics
1.1.5.6 Other Applications
1.1.6 Product Types
1.1.6.1 Polylactic Acid (PLA)
1.1.6.2 Starch-Based Plastics
1.1.6.3 Polyhydroxyalkanoates (PHA)
1.1.6.4 Polybutylene Adipate Terephthalate (PBAT)
1.1.6.5 Other Biodegradable Plastics
1.1.6.6 Bio-Polyethylene (PE)
1.1.6.7 Other Non-Biodegradable Plastics
1.2 Europe
1.2.1 Demand
1.2.2 Revenues
1.2.3 Production
1.2.4 Applications and Product Types
1.3 North America
1.3.1 Demand
1.3.2 Revenues
1.3.3 Production
1.3.4 Applications and Product Types
1.4 Asia-Pacific
1.4.1 Demand
1.4.2 Revenues
1.4.3 Production
1.4.4 Applications and Product Types
1.5 Rest of World
1.5.1 Demand
1.5.2 Revenues
1.5.3 Production
1.5.4 Applications and Product Types
2 Market Data: Country Profiles
(For each country: data on revenues as well as demand split by application and split by product)
2.1 Europe
2.1.1 France
2.1.2 Germany
2.1.3 Italy
2.1.4 Spain
2.1.5 The Netherlands
2.1.6 United Kingdom
2.1.7 Other Europe
2.2 North America
2.2.1 Canada & Mexico
2.2.2 USA
2.3 Asia-Pacific
2.3.1 China
2.3.2 Japan
2.3.3 South Korea
2.3.4 Taiwan
2.3.5 Other Asia-Pacific
3 Company Profiles*
3.1 Western Europe
Austria (2 Producers)
Belgium (1)
Finland (1)
France (3)
Germany (4)
Italy (3)
Norway (1)
Spain (3)
Switzerland (1)
The Netherlands (3)
3.2 North America
Canada (1)
Mexico (1)
USA (10)
3.3 South America
Brazil (1)
3.4 Asia-Pacific
Australia (1)
China (12)
Japan (5)
Singapore (1)
South Korea (2)
Taiwan (1)
Thailand (1)
Vietnam (1)
3.5 Middle East
Saudi Arabia (1)
*Note: The profiles are assigned to the country in which the company or holding is headquartered. Profiles also include JVs and subsidiaries.
soon to come
soon to come


