

Description
The Plastic Packaging for Cosmetics & Personal Care Products Market Report – Europe is now also available in parts (e.g. individual country profiles or all manufacturer profiles). Please feel free to contact us and we will immediately send you an offer for your specific selection.
Beauty without a guilty conscience? The ‘Selfie Generation’ not only wants to look good, they also care about sustainable consumption. These contradictory trends pose a major challenge for cosmetics manufacturers. The latest study by Ceresana examines European demand for plastic packaging for cosmetics and personal care products. It distinguishes 13 application areas and 7 different types of packaging. The report covers both the historical development and future growth prospects of this particular packaging market. The analysts forecast that the market volume of plastic packaging for cosmetics and personal care products in Europe will grow to around 28.9 billion units by 2026.
Numerous Factors Influence Individual Segments
Plastics are increasingly controversial. However, sales of plastic packaging for cosmetics are expected to continue to rise. The trend towards flawless self–presentation in social media and in some countries also the rising number of working women is driving sales of beauty products. The fact that Europeans are getting older and older is providing impetus in the skin care sector. The sub segments “personal care – oral care” and “skin care – sun protection” benefit from growing health awareness and the fear of high medical costs. Changes in European climate will further increase the demand for sun protection products in the coming years.
Practicability and Sustainability are a Plus
The market dynamics in the individual sub segments of the cosmetics and personal care industry vary considerably. Thus, some packaging types benefit more than others. In addition to the visual appearance and practicability of the packaging, sustainability is becoming more and more important. Flexible packaging, for example, can further reduce the amount of materials that are used. The usage of this type of packaging will increase by approx. 2.1% per year in the coming years.
The Study in Brief:
Chapter 1 offers an overview of the European Market for plastic packaging for cosmetics and personal care products including forecasts until 2026. Data on demand volumes as well as on the individual application areas and packaging types is listed in clear tables and graphs. The data is presented in number of units.
Chapter 2 offers detailed information on demand in 26 individual countries (e.g. Russia, Switzerland, and Turkey). In addition, demand is split by the following application areas and packaging types:
Application areas:
- Cosmetics – Face
- Cosmetics – Lips
- Cosmetics – Eyes
- Cosmetics – Nails
- Skin Care – Face
- Skin Care – Body
- Skin Care – Sun Protection
- Skin Care – Baby and Child
- Personal Care – Hair Care
- Personal Care – Shower and Bath
- Personal Care – Oral Care
- Personal Care – Deodorants
- Personal Care – Hair Removal
Packaging types:
- Screw Bottles
- Squeeze Bottles
- Dispensers and Spray Bottles
- Jars, Cans etc.
- Tubes
- Flexible Packaging
- Blister Packaging
Scope of the Report:
Attributes | Details |
| Base Year | 2018 |
| Trend Period | 2010 – 2026 |
| Forecast Period | 2019 – 2026 |
| Pages | 140 |
| Application Areas | Cosmetics – Face, Cosmetics – Lips, Cosmetics – Eyes, Cosmetics – Nails, Skin Care – Face, Skin Care – Body, Skin Care – Sun Protection, Skin Care – Baby and Child, Personal Care – Hair Care, Personal Care – Shower and Bath, Personal Care – Oral Care, Personal Care – Deodorants, Personal Care – Hair Removal |
| Packaging Types | Screw Bottles, Squeeze Bottles, Dispensers and Spray Bottles, Jars/Cans etc., Tubes, Flexible Packaging, Blister Packaging |
| Edition | 1st edition |
| Publication | February 2020 |
FAQs
What will be the market volume of plastic packaging for cosmetics and personal care products by 2026?
The analysts forecast that the market volume of plastic packaging for cosmetics and personal care products in Europe will grow to around 28.9 billion units by 2026.
How will the demand for flexible packaging develop?
As flexible packaging makes it possible to further reduce material usage, the use of this type of packaging is expected to increase by around 2.1% per year in the coming years.
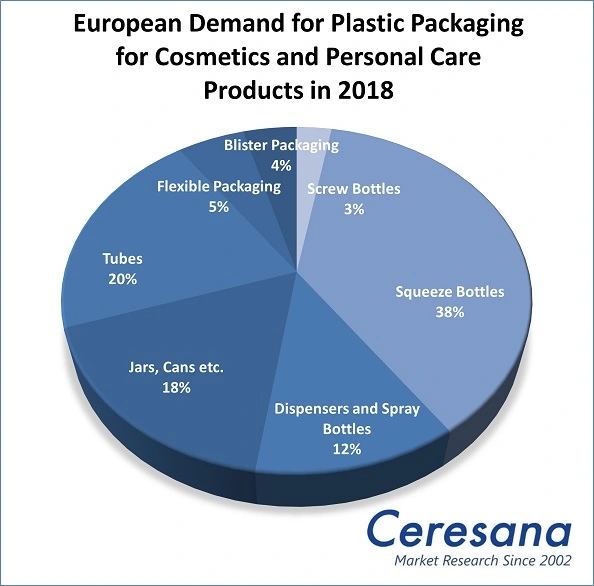
Which packaging type will have the largest market share?
The largest share of the plastic packaging market for cosmetics & personal care products is held by squeeze bottles with 38%. This is followed by tubes with 20% and jars/cans with 18%.
1 Market Data: Region
1.1 World
1.1.1 Demand
1.1.2 Application Areas
1.1.2.1 Cosmetics – Face
1.1.2.2 Cosmetics – Lips
1.1.2.3 Cosmetics – Eyes
1.1.2.4 Cosmetics – Nails
1.1.2.5 Skin Care – Face
1.1.2.6 Skin Care – Body
1.1.2.7 Skin Care – Sun Protection
1.1.2.8 Skin Care – Baby and Child
1.1.2.9 Personal Care – Hair Care
1.1.2.10 Personal Care – Shower and Bath
1.1.2.11 Personal Care – Oral Care
1.1.2.12 Personal Care – Deodorants
1.1.2.13 Personal Care – Hair Removal
1.1.3 Product Types
1.1.3.1 Screw Bottles
1.1.3.2 Squeeze Bottles
1.1.3.3 Dispensers and Spray Bottles
1.1.3.4 Jars, Cans etc.
1.1.3.5 Tubes
1.1.3.6 Flexible Packaging
1.1.3.7 Blister Packaging
2 Market Data: Country Profiles
(For each country: Demand split by applications and packaging types)
2.1 Europe
2.1.1 Austria
2.1.2 Belgium
2.1.3 Bulgaria
2.1.4 Croatia
2.1.5 Czechia
2.1.6 Denmark
2.1.7 Finland
2.1.8 France
2.1.9 Germany
2.1.10 Greece
2.1.11 Hungary
2.1.12 Ireland
2.1.13 Italy
2.1.14 Lithuania
2.1.15 Norway
2.1.16 Poland
2.1.17 Portugal
2.1.18 Romania
2.1.19 Russia
2.1.20 Slovakia
2.1.21 Spain
2.1.22 Sweden
2.1.23 Switzerland
2.1.24 The Netherlands
2.1.25 Turkey
2.1.26 United Kingdom
2.1.27 Rest of Europe
Graph 1: European demand for plastic packaging for cosmetics and personal care products from 2010 to 2026
Graph 2: European demand for plastic packaging for cosmetics and personal care products from 2010 to 2026 – split by packaging types
Graph 3: Demand for plastic packaging for cosmetics and personal care products in Austria from 2010 to 2026
Graph 4: Demand for plastic packaging for cosmetics and personal care products in Belgium from 2010 to 2026
Graph 5: Demand for plastic packaging for cosmetics and personal care products in Bulgaria from 2010 to 2026
Graph 6: Demand for plastic packaging for cosmetics and personal care products in Croatia from 2010 to 2026
Graph 7: Demand for plastic packaging for cosmetics and personal care products in Czechia from 2010 to 2026
Graph 8: Demand for plastic packaging for cosmetics and personal care products in Denmark from 2010 to 2026
Graph 9: Demand for plastic packaging for cosmetics and personal care products on Finland from 2010 to 2026
Graph 10: Demand for plastic packaging for cosmetics and personal care products in France from 2010 to 2026
Graph 11: Demand for plastic packaging for cosmetics and personal care products in Germany from 2010 to 2026
Graph 12: Demand for plastic packaging for cosmetics and personal care products in Greece from 2010 to 2026
Graph 13: Demand for plastic packaging for cosmetics and personal care products in Hungary from 2010 to 2026
Graph 14: Demand for plastic packaging for cosmetics and personal care products in Ireland from 2010 to 2026
Graph 15: Demand for plastic packaging for cosmetics and personal care products in Italy from 2010 to 2026
Graph 16: Demand for plastic packaging for cosmetics and personal care products in Lithuania from 2010 to 2026
Graph 17: Demand for plastic packaging for cosmetics and personal care products in Norway from 2010 to 2026
Graph 18: Demand for plastic packaging for cosmetics and personal care products in Poland from 2010 to 2026
Graph 19: Demand for plastic packaging for cosmetics and personal care products in Portugal from 2010 to 2026
Graph 20: Demand for plastic packaging for cosmetics and personal care products in Romania from 2010 to 2026
Graph 21: Demand for plastic packaging for cosmetics and personal care products in Russia from 2010 to 2026
Graph 22: Demand for plastic packaging for cosmetics and personal care products in Slovakia from 2010 to 2026
Graph 23: Demand for plastic packaging for cosmetics and personal care products in Spain from 2010 to 2026
Graph 24: Demand for plastic packaging for cosmetics and personal care products in Sweden from 2010 to 2026
Graph 25: Demand for plastic packaging for cosmetics and personal care products in Switzerland from 2010 to 2026
Graph 26: Demand for plastic packaging for cosmetics and personal care products in the Netherlands from 2010 to 2026
Graph 27: Demand for plastic packaging for cosmetics and personal care products in Turkey from 2010 to 2026
Graph 28: Demand for plastic packaging for cosmetics and personal care products in the United Kingdom from 2010 to 2026
Graph 29: Demand for plastic packaging for cosmetics and personal care products in the remaining European countries from 2010 to 2026
Table 1: European demand for plastic packaging for cosmetics and personal care products from 2010 to 2026 – split by application areas
Table 2: European demand for plastic packaging for cosmetics and personal care products in the segment cosmetics “Cosmetics – Face” from 2010 to 2026 – split by countries
Table 3: European demand for plastic packaging for cosmetics and personal care products in the segment “Cosmetics – Lips” from 2010 to 2026 – split by countries
Table 4: European demand for plastic packaging for cosmetics and personal care products in the segment “Cosmetics – Eyes” from 2010 to 2026 – split by countries
Table 5: European demand for plastic packaging for cosmetics and personal care products in the segment “Cosmetics – Nails” from 2010 to 2026 – split by countries
Table 6: European demand for plastic packaging for cosmetics and personal care products in the segment “Skin Care – Face” from 2010 to 2026 – split by countries
Table 7: European demand for plastic packaging for cosmetics and personal care products in the segment “Skin Care – Body” from 2010 to 2026 – split by countries
Table 8: European demand for plastic packaging for cosmetics and personal care products in the segment “Skin Care – Sun Protection” from 2010 to 2026 – split by countries
Table 9: European demand for plastic packaging for cosmetics and personal care products in the segment “Skin Care – Baby and Child” from 2010 to 2026 – split by countries
Table 10: European demand for plastic packaging for cosmetics and personal care products in the segment “Personal Care – Hair Care” from 2010 to 2026 – split by countries
Table 11: European demand for plastic packaging for cosmetics and personal care products in the segment “Personal Care – Shower and Bath” from 2010 to 2026 – split by countries
Table 12: European demand for plastic packaging for cosmetics and personal care products in the segment “Personal Care – Oral Care” from 2010 to 2026 – split by countries
Table 13: European demand for plastic packaging for cosmetics and personal care products in the segment “Personal Care – Deodorants” from 2010 to 2026 – split by countries
Table 14: European demand for plastic packaging for cosmetics and personal care products in the segment “Personal Care – Hair Removal” from 2010 to 2026 – split by countries
Table 15: European demand for plastic packaging for cosmetics and personal care products from 2010 to 2026 – split by packaging types
Table 16: European demand for screw bottles from 2010 to 2026 – split by countries
Table 17: European demand for squeeze bottles from 2010 to 2026 – split by countries
Table 18: European demand for dispensers and spray bottles from 2010 to 2026 – split by countries
Table 19: European demand for jars, cans etc. from 2010 to 2026 – split by countries
Table 20: European demand for plastic tubes from 2010 to 2026 – split by countries
Table 21: European demand for flexible plastic packaging from 2010 to 2026 – split by countries
Table 22: European demand for blister packaging from 2010 to 2026 – split by countries
Table 23: Demand for plastic packaging for cosmetics and personal care products in Austria from 2010 to 2026 – split by application areas
Table 24: Demand for plastic packaging for cosmetics and personal care products in Austria from 2010 to 2026 – split by packaging types
Table 25: Demand for plastic packaging for cosmetics and personal care products in Belgium from 2010 to 2026 – split by application areas
Table 26: Demand for plastic packaging for cosmetics and personal care products in Belgium from 2010 to 2026 – split by packaging types
Table 27: Demand for plastic packaging for cosmetics and personal care products in Bulgaria from 2010 to 2026 – split by applications
Table 28: Demand for plastic packaging for cosmetics and personal care products in Bulgaria from 2010 to 2026 – split by packaging types
Table 29: Demand for plastic packaging for cosmetics and personal care products in Croatia from 2010 to 2026 – split by applications
Table 30: Demand for plastic packaging for cosmetics and personal care products in Croatia from 2010 to 2026 – split by packaging types
Table 31: Demand for plastic packaging for cosmetics and personal care products in Czechia from 2010 to 2026 – split by application areas
Table 32: Demand for plastic packaging for cosmetics and personal care products in Czechia from 2010 to 2026 – split by packaging types
Table 33: Demand for plastic packaging for cosmetics and personal care products in Denmark from 2010 to 2026 – split by application areas
Table 34: Demand for plastic packaging for cosmetics and personal care products in Denmark from 2010 to 2026 – split by packaging types
Table 35: Demand for plastic packaging for cosmetics and personal care products in Finland from 2010 to 2026 – split by application areas
Table 36: Demand for plastic packaging for cosmetics and personal care products in Finland from 2010 to 2026 – split by packaging types
Table 37: Demand for plastic packaging for cosmetics and personal care products in France from 2010 to 2026 – split by application areas
Table 38: Demand for plastic packaging for cosmetics and personal care products in France from 2010 to 2026 – split by packaging types
Table 39: Demand for plastic packaging for cosmetics and personal care products in Germany from 2010 to 2026 – split by application areas
Table 40: Demand for plastic packaging for cosmetics and personal care products in Germany from 2010 to 2026 – split by packaging types
Table 41: Demand for plastic packaging for cosmetics and personal care products in Greece from 2010 to 2026 – split by application areas
Table 42: Demand for plastic packaging for cosmetics and personal care products in Greece from 2010 to 2026 – split by packaging types
Table 43: Demand for plastic packaging for cosmetics and personal care products in Hungary from 2010 to 2026 – split by application areas
Table 44: Demand for plastic packaging for cosmetics and personal care products in Hungary from 2010 to 2026 – split by packaging types
Table 45: Demand for plastic packaging for cosmetics and personal care products in Ireland from 2010 to 2026 – split by application areas
Table 46: Demand for plastic packaging for cosmetics and personal care products in Ireland from 2010 to 2026 – split by packaging types
Table 47: Demand for plastic packaging for cosmetics and personal care products in Italy from 2010 to 2026 – split by application areas
Table 48: Demand for plastic packaging for cosmetics and personal care products in Italy from 2010 to 2026 – split by packaging types
Table 49: Demand for plastic packaging for cosmetics and personal care products in Lithuania from 2010 to 2026 – split by application areas
Table 50: Demand for plastic packaging for cosmetics and personal care products in Lithuania from 2010 to 2026 – split by packaging types
Table 51: Demand for plastic packaging for cosmetics and personal care products in Norway from 2010 to 2026 – split by application areas
Table 52: Demand for plastic packaging for cosmetics and personal care products in Norway from 2010 to 2026 – split by packaging types
Table 53: Demand for plastic packaging for cosmetics and personal care products in Poland from 2010 to 2026 – split by application areas
Table 54: Demand for plastic packaging for cosmetics and personal care products in Poland from 2010 to 2026 – split by packaging types
Table 55: Demand for plastic packaging for cosmetics and personal care products in Portugal from 2010 to 2026 – split by application areas
Table 56: Demand for plastic packaging for cosmetics and personal care products in Portugal from 2010 to 2026 – split by packaging types
Table 57: Demand for plastic packaging for cosmetics and personal care products in Romania from 2010 to 2026 – split by application areas
Table 58: Demand for plastic packaging for cosmetics and personal care products in Romania from 2010 to 2026 – split by packaging types
Table 59: Demand for plastic packaging for cosmetics and personal care products in Russia from 2010 to 2026 – split by application areas
Table 60: Demand for plastic packaging for cosmetics and personal care products in Russia from 2010 to 2026 – split by packaging types
Table 61: Demand for plastic packaging for cosmetics and personal care products in Slovakia from 2010 to 2026 – split by application areas
Table 62: Demand for plastic packaging for cosmetics and personal care products in Slovakia from 2010 to 2026 – split by packaging types
Table 63: Demand for plastic packaging for cosmetics and personal care products in Spain from 2010 to 2026 – split by application areas
Table 64: Demand for plastic packaging for cosmetics and personal care products in Spain from 2010 to 2026 – split by packaging types
Table 65: Demand for plastic packaging for cosmetics and personal care products in Sweden from 2010 to 2026 – split by application areas
Table 66: Demand for plastic packaging for cosmetics and personal care products in Sweden from 2010 to 2026 – split by packaging types
Table 67: Demand for plastic packaging for cosmetics and personal care products in Switzerland from 2010 to 2026 – split by application areas
Table 68: Demand for plastic packaging for cosmetics and personal care products in Switzerland from 2010 to 2026 – split by packaging types
Table 69: Demand for plastic packaging for cosmetics and personal care products in the Netherlands from 2010 to 2026 – split by application areas
Table 70: Demand for plastic packaging for cosmetics and personal care products in the Netherlands from 2010 to 2026 – split by packaging types
Table 71: Demand for plastic packaging for cosmetics and personal care products in Turkey from 2010 to 2026 – split by application areas
Table 72: Demand for plastic packaging for cosmetics and personal care products in Turkey from 2010 to 2026 – split by packaging types
Table 73: Demand for plastic packaging for cosmetics and personal care products in the United Kingdom from 2010 to 2026 – split by application areas
Table 74: Demand for plastic packaging for cosmetics and personal care products in the United Kingdom from 2010 to 2026 – split by packaging types
Table 75: Demand for plastic packaging for cosmetics and personal care products in the remaining European countries from 2010 to 2026 – split by application areas
Table 76: Demand for plastic packaging for cosmetics and personal care products in the remaining European countries from 2010 to 2026 – split by packaging types


