

Description
The Plastic Films Market Report – World is now also available in parts (e.g. individual country profiles or all manufacturer profiles). Please feel free to contact us and we will immediately send you an offer for your specific selection.
Stretching towards success: Plastic films get stronger and more transparent if they are stretched longitudinally and crosswise during production. The “biaxially oriented” plastics polypropylene (BOPP), polyethylene (BOPE) and polyester (BOPET) are processed into packaging, bags and sacks, shrink and stretch films, but also, for example, agricultural films, insulation material and industrial films. According to the latest Ceresana study on the global market for flexible plastic films, which is already the third edition, the revenues generated with these films will increase to around USD 339 billion by 2032. The transition from thin films to thick sheets is fluid; this study does not cover sheets, panels and plates used for rigid packaging such as boxes, cartons or crates.
Bag Bans: Every Micrometer Counts
The market for packaging films is growing strongly, although more and more countries are trying to take action against plastic waste. Within the European Union, disposable plastic carrier bags thinner than 0.05 millimeters are banned. However, some supermarket chains are now simply issuing slightly thicker bags, for example with wall thicknesses of 53 or 55 micrometers. Paper-thin shirt bags with less than 15 micrometers will continue to be allowed in the self-service section for loose fruits, vegetables and other perishable foods regardless. Ceresana analysts expect an average growth of 3.9% per year for thicker BOPET films of 50 micrometers or more, which are used, for example, for packaging stationery or electronic goods.
The Aftermath of COVID
The trend towards online retailing and hygienic individual packaging continues even after the end of the COVID-19 pandemic. This not only increases the demand for secondary and transport packaging such as shrink and stretch films, but also for adhesive tapes, most of which are also made from plastic films. In the already developed countries, “zero waste shops”, which are already a small niche, have been hit hard by COVID; in the rest of the world, on the other hand, the trend towards plastic packaging continues unabated. Stand-up pouches and microwavable packaging in particular are on the rise, as are individual packages that offer better dispensability and shelf life. At present, however, the persistently high inflation in many countries is causing a certain decline in consumer confidence.
Bioplastics Fertilize the Fields
Agricultural films are another segment with strong growth: climate change entails more frequent extreme weather conditions, which in turn increase the need for better protection of strawberries and asparagus fields, for example. The ongoing intensification of agriculture is also increasing the consumption of agricultural films. Bioplastics can already be commercially successful in horticulture, agriculture and forestry: Films made from starch, polylactic acid (PLA) or other biopolymers do not have to be disposed of at high cost after use, but can serve as compost on site. Other industries are also increasingly turning to “bio” products: Biobased paints, coatings and insulating materials, for example, are appropriately supplied in biobased packaging by the construction industry.
Overview of the Study
Chapter 1 analyzes the global market for plastic films with forecasts up to 2032: production and demand volumes in tonnes, as well as revenues in USD and EUR are provided globally and for individual regions.
Global demand is broken down for the different types of plastics:
- Polyethylene (PE)
- Polypropylene (unoriented CPP, BOPP, other PP)
- BOPET < 50 µm
- BOPET > 50 µm
- PVC
- Other plastics.
In Chapter 2, 18 countries are considered individually.
Country-specific demand, revenues, and production volume per film type are presented:
The demand is further analyzed for the individual application areas.
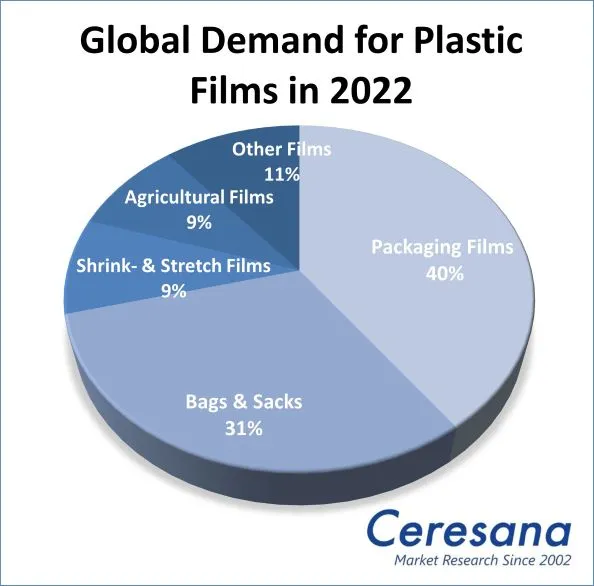
- Packaging Films
- Bags & Sacks
- Shrink & Stretch Films
- Agricultural Films
- Other Applications
Chapter 3 provides company profiles of the most important plastic film producers, clearly arranged by contact details, revenues, profit, product range, production facilities and brief profile. Detailed profiles are provided by 99 manufacturers, such as Amcor Ltd., Berry Plastics Corporation, DuPont (E.I.) De Nemours, ExxonMobil Chemical Company, Oben Holding Group, RKW SE, Saudi Basic Industries Corp. (SABIC), Sealed Air Corporation, The Dow Chemical Company, and Toray Industries, Inc.
Scope of the Report:
Attributes | Details |
| Base Year | 2022 |
| Trend Period | 2020 – 2032 |
| Forecast Period | 2023 – 2032 |
| Pages | 380 |
| Types of Plastics | Polyethylene, Polypropylene, BOPET, Polyvinyl Chloride (PVC), Other Plastics |
| Film Type | LDPE, LLDPE, HDPE, PP, BOPET, PVC, Other Plastics |
| Application Area | Packaging Films, Bags & Sacks, Shrink & Stretch Films, Agricultural Films, Other Applications |
| Company Profiles | Amcor Ltd., Berry Plastics Corporation, DuPont (E.I.) De Nemours, ExxonMobil Chemical Company, Oben Holding Group, RKW SE, Saudi Basic Industries Corp. (SABIC), Sealed Air Corporation, The Dow Chemical Company, and Toray Industries, Inc. (Selection) |
| Edition | 3rd edition |
| Publication | May 2023 |
FAQs
How will global revenues generated with plastic films develop until 2032?
Revenues generated with plastic films will increase to around USD 339 billion by 2032.
What trends can be observed with regard to the area of application?
Not only the demand for secondary and transport packaging such as shrink and stretch films will increase, but also for adhesive tapes, most of which are also made from plastic films.
1 Market Data: World and Regions
1.1 World
1.1.1 Demand
1.1.2 Revenues
1.1.3 Production
1.1.4 Demand Split by Application Area
1.1.5 Demand Split by Material
1.1.6 Production Split by Material
1.2 Western Europe
1.2.1 Demand
1.2.2 Revenues
1.2.3 Production
1.2.4 Application Areas and Materials
1.3 Eastern Europe
1.3.1 Demand
1.3.2 Revenues
1.3.3 Production
1.3.4 Application Areas and Materials
1.4 North America
1.4.1 Demand
1.4.2 Revenues
1.4.3 Production
1.4.4 Application Areas and Materials
1.5 South America
1.5.1 Demand
1.5.2 Revenues
1.5.3 Production
1.5.4 Application Areas and Materials
1.6 Asia-Pacific
1.6.1 Demand
1.6.2 Revenues
1.6.3 Production
1.6.4 Application Areas and Materials
1.7 Middle East
1.7.1 Demand
1.7.2 Revenues
1.7.3 Production
1.7.4 Application Areas and Materials
1.8 Africa
1.8.1 Demand
1.8.2 Revenues
1.8.3 Production
1.8.4 Application Areas and Materials
2 Market Data: Countries
2.1 Western Europe
2.1.1 France
2.1.2 Germany
2.1.3 Italy
2.1.4 Spain
2.1.5 United Kingdom
2.1.6 Other Western Europe
2.2 Eastern Europe
2.2.1 Poland
2.2.2 Russia
2.2.3 Turkey
2.2.4 Other Eastern Europe
2.3 North America
2.3.1 Canada
2.3.2 Mexico
2.3.3 USA
2.4 South America
2.4.1 Argentina
2.4.2 Brazil
2.4.3 Other South America
2.5 Asia-Pacific
2.5.1 China
2.5.2 India
2.5.3 Japan
2.5.4 South Korea
2.5.5 Thailand
2.5.6 Other Asia-Pacific
3 Company Profiles
3.1 Western Europe
Austria (3 Producer)
Belgium (1)
Finland (3)
France (3)
Germany (15)
Italy (7)
Spain (1)
Sweden (1)
Switzerland (1)
The Netherlands (1)
United Kingdom (4)
3.2 Eastern Europe
Czechia (1)
Greece (1)
Poland (2)
Russia (1)
Slovakia (1)
Turkey (2)
3.3 North America
Canada (2)
USA (16)
3.4 South America
Brazil (1)
Peru (1)
3.5 Asia-Pacific
Australia (1)
China (4)
India (7)
Indonesia (2)
Japan (8)
Malaysia (1)
South Korea (1)
Taiwan (1)
3.6 Middle East
Lebanon (1)
Qatar (1)
Saudi Arabia (2)
United Arab Emirates (2)
Graph 1: Global demand from 2020 to 2032
Graph 2: Global demand from 2020 to 2032 – split by region
Graph 3: Global revenues from 2020 to 2032 in billion USD and billion EUR
Graph 4: Global revenues from 2020 to 2032 in billion USD – split by region
Graph 5: Global revenues from 2020 to 2032 in billion EUR – split by region
Graph 6: Global production from 2020 to 2032
Graph 7: Global production from 2020 to 2032 – split by region
Graph 8: Global demand from 2020 to 2032 – split by application
Graph 9: Global demand in the application area of “packaging films” from 2020 to 2032 – split by region
Graph 10: Global demand for plastic films in the application area of “bags & sacks” from 2020 to 20232 – split by region
Graph 11: Global demand in the application area of “shrink & stretch films” from 2020 to 2032 – split by region
Graph 12: Global demand in the application area of “agricultural films” from 2020 to 2032 – split by region
Graph 13: Global demand in other applications from 2020 to 2032 – split by region
Graph 14: Global demand from 2020 to 2032 – split by material
Graph 15: Global demand for polyethylene films from 2020 to 2032 – split by region
Graph 16: Global demand for PP films from 2020 to 2032 – split by region
Graph 17: Global demand for BOPET films from 2020 to 2032 – split by region
Graph 18: Global demand for PVC films from 2020 to 2032 – split by region
Graph 19: Global demand for films made of other plastics from 2020 to 2032 – split by region
Graph 20: Demand in Western Europe from 2020 to 2032
Graph 21: Revenues generated in Western Europe from 2020 to 2032 in billion USD and billion EUR
Graph 22: Production in Western Europe from 2020 to 2032
Graph 23: Demand in Western Europe from 2020 to 2032 – split by application
Graph 24: Demand in Eastern Europe from 2020 to 2032
Graph 25: Revenues in Eastern Europe from 2020 to 2032 in billion USD and billion EUR
Graph 26: Production in Eastern Europe from 2020 to 2032
Graph 27: Demand in Eastern Europe from 2020 to 2032 – split by application
Graph 28: Demand in North America from 2020 to 2032
Graph 29: Revenues generated in North America from 2020 to 2032 in billion USD and billion EUR
Graph 30: Production in North America from 2020 to 2032
Graph 31: Demand in North America from 2020 to 2032 – split by application
Graph 32: Demand in South America from 2020 to 2032
Graph 33: Revenues in South America from 2020 to 2032 in billion USD and billion EUR
Graph 34: Production in South America from 2020 to 2032
Graph 35: Demand in South America from 2020 to 2032 – split by application
Graph 36: Demand in Asia-Pacific from 2020 to 2032
Graph 37: Revenues generated in Asia-Pacific from 2020 to 2032 in billion USD and billion EUR
Graph 38: Production in Asia-Pacific from 2020 to 2032
Graph 39: Demand in Asia-Pacific from 2020 to 2032 – split by application
Graph 40: Demand in the Middle East from 2020 to 2032
Graph 41: Revenues in the Middle East from 2020 to 2032 in billion USD and billion EUR
Graph 42: Production in the Middle East from 2020 to 2032
Graph 43: Demand in the Middle East from 2020 to 2032 – split by application
Graph 44: Demand in Africa from 2020 to 2032
Graph 45: Revenues in Africa from 2020 to 2032 in billion USD and billion EUR
Graph 46: Production in Africa from 2020 to 2032
Graph 47: Demand in Africa from 2020 to 2032 – split by application
Graph 48: Demand in France from 2020 to 2032
Graph 49: Production in France from 2020 to 2032
Graph 50: Demand in Germany from 2020 to 2032
Graph 51: Production in Germany from 2020 to 2032
Graph 52: Demand in Italy from 2020 to 2032
Graph 53: Production in Italy from 2020 to 2032
Graph 54: Demand in Spain from 2020 to 2032
Graph 55: Production in Spain from 2020 to 2032
Graph 56: Demand in the United Kingdom from 2020 to 2032
Graph 57: Production in the United Kingdom from 2020 to 2032
Graph 58: Demand in the remaining countries of Western Europe from 2020 to 2032
Graph 59: Production in the remaining countries of Western Europe from 2020 to 2032
Graph 60: Demand in Poland from 2020 to 2032
Graph 61: Production in Poland from 2020 to 2032
Graph 62: Demand in Russia from 2020 to 2032
Graph 63: Production in Russia from 2020 to 2032
Graph 64: Demand in Turkey from 2020 to 2032
Graph 65: Production in Turkey from 2020 to 2032
Graph 66: Demand in the remaining countries of Eastern Europe from 2020 to 2032
Graph 67: Production in the remaining countries of Eastern Europe from 2020 to 2032
Graph 68: Demand in Canada from 2020 to 2032
Graph 69: Production in Canada from 2020 to 2032
Graph 70: Demand in Mexico from 2020 to 2032
Graph 71: Production in Mexico from 2020 to 2032
Graph 72: Demand in the USA from 2020 to 2032
Graph 73: Production in the USA from 2020 to 2032
Graph 74: Demand in Argentina from 2020 to 2032
Graph 75: Production in Argentina from 2020 to 2032
Graph 76: Demand in Brazil from 2020 to 2032
Graph 77: Production in Brazil from 2020 to 2032
Graph 78: Demand in the remaining countries of South America from 2020 to 2032
Graph 79: Production in the remaining countries of South America from 2020 to 2032
Graph 80: Demand in China from 2020 to 2032
Graph 81: Production in China from 2020 to 2032
Graph 82: Demand in India from 2020 to 2032
Graph 83: Production in India from 2020 to 2032
Graph 84: Demand in Japan from 2020 to 2032
Graph 85: Production in Japan from 2020 to 2032
Graph 86: Demand in South Korea from 2020 to 2032
Graph 87: Production in South Korea from 2020 to 2032
Graph 88: Demand in Thailand from 2020 to 2032
Graph 89: Production in Thailand from 2020 to 2032
Graph 90: Demand in the remaining countries of Asia-Pacific from 2020 to 2032
Graph 91: Production in the remaining countries of Asia-Pacific from 2020 to 2032
Table 1: Global demand from 2020 to 2032 – split by region
Table 2: Global revenues from 2020 to 2032 in billion USD – split by region
Table 3: Global revenues from 2020 to 2032 in billion EUR – split by region
Table 4: Global production from 2020 to 2032 – split by region
Table 5: Global demand from 2020 to 2032 – split by application
Table 6: Global demand in the application area of “packaging films” from 2020 to 2032 – split by region
Table 7: Global demand for plastic films in the application area of “bags & sacks” from 2020 to 20232 – split by region
Table 8: Global demand in the application area of “shrink & stretch films” from 2020 to 2032 – split by region
Table 9: Global demand in the application area of “agricultural films” from 2020 to 2032 – split by region
Table 10: Global demand in other applications from 2020 to 2032 – split by region
Table 11: Global demand from 2020 to 2032 – split by material
Table 12: Global demand for polyethylene films from 2020 to 2032 – split by region
Table 13: Global demand for PP films from 2020 to 2032 – split by region
Table 14: Global demand for BOPET films from 2020 to 2032 – split by region
Table 15: Global demand for PVC films from 2020 to 2032 – split by region
Table 16: Global demand for films made of other plastics from 2020 to 2032 – split by region
Table 17: Global production from 2020 to 2032 – split by material
Table 18: Global production of polyethylene films from 2020 to 2032 – split by region
Table 19: Global production of LDPE films from 2020 to 2032 – split by region
Table 20: Global production of LLDPE films from 2020 to 2032 – split by region
Table 21: Global production of HDPE films from 2020 to 2032 – split by region
Table 22: Global production of PP films from 2020 to 2032 – split by region
Table 23: Global production of BOPET films from 2020 to 2032 – split by region
Table 24: Global production of PVC films from 2020 to 2032 – split by region
Table 25: Global production of other products from 2020 to 2032 – split by region
Table 26: Demand in Western Europe from 2020 to 2032 – split by major country
Table 27: Revenues generated in Western Europe from 2020 to 2032 in billion USD and billion EUR
Table 28: Production in Western Europe from 2020 to 2032 – split by major country
Table 29: Production in Western Europe from 2020 to 2032 – split by type of material
Table 30: Demand in Western Europe from 2020 to 2032 – split by application
Table 31: Demand in Western Europe from 2020 to 2032 – split by type of material
Table 32: Demand in Eastern Europe from 2020 to 2032 – split by major country
Table 33: Revenues in Eastern Europe from 2020 to 2032 in billion USD and billion EUR
Table 34: Production in Eastern Europe from 2020 to 2032 – split by major country
Table 35: Production in Eastern Europe from 2020 to 2032 – split by type of material
Table 36: Demand in Eastern Europe from 2020 to 2032 – split by application
Table 37: Demand in Eastern Europe from 2020 to 2032 – split by type of material
Table 38: Demand in North America from 2020 to 2032 – split by major country
Table 39: Revenues generated in North America from 2020 to 2032 in billion USD and billion EUR
Table 40: Production in North America from 2020 to 2032 – split by major country
Table 41: Production in North America from 2020 to 2032 – split by type of material
Table 42: Demand in North America from 2020 to 2032 – split by application
Table 43: Demand in North America from 2020 to 2032 – split by type of material
Table 44: Demand in South America from 2020 to 2032 – split by major country
Table 45: Revenues in South America from 2020 to 2032 in billion USD and billion EUR
Table 46: Production in South America from 2020 to 2032 – split by major country
Table 47: Production in Poland from 2020 to 2032 – split by type of material
Table 48: Demand in South America from 2020 to 2032 – split by application
Table 49: Demand in South America from 2020 to 2032 – split by product
Table 50: Demand in Asia-Pacific from 2020 to 2032 – split by major country
Table 51: Revenues generated in Asia-Pacific from 2020 to 2032 in billion USD and billion EUR
Table 52: Production in Asia-Pacific from 2020 to 2032 – split by major country
Table 53: Production in Asia-Pacific from 2020 to 2032 – split by type of material
Table 54: Demand in Asia-Pacific from 2020 to 2032 – split by application
Table 55: Demand in Asia-Pacific from 2020 to 2032 – split by type of material
Table 56: Revenues in the Middle East from 2020 to 2032 in billion USD and billion EUR
Table 57: Production in the Middle East from 2020 to 2032 – split by type of material
Table 58: Demand in the Middle East from 2020 to 2032 – split by application
Table 59: Demand in the Middle East from 2020 to 2032 – split by type of material
Table 60: Revenues in Africa from 2020 to 2032 in billion USD and billion EUR
Table 61: Production in Africa from 2020 to 2032 – split by type of material
Table 62: Demand in Africa from 2020 to 2032 – split by application
Table 63: Demand in Africa from 2020 to 2032 – split by type of material
Table 64: Revenues generated in France from 2020 to 2032 in billion USD and billion EUR
Table 65: Demand in France from 2020 to 2032 – split by application
Table 66: Demand in France from 2020 to 2032 – split by type of material
Table 67: Production in France from 2020 to 2032 – split by type of material
Table 68: Revenues generated in Germany from 2020 to 2032 in billion USD and billion EUR
Table 69: Demand in Germany from 2020 to 2032 – split by application
Table 70: Demand in Germany from 2020 to 2032 – split by type of material
Table 71: Production in Germany from 2020 to 2032 – split by type of material
Table 72: Revenues generated in Italy from 2020 to 2032 in billion USD and billion EUR
Table 73: Demand in Italy from 2020 to 2032 – split by application
Table 74: Demand in Italy from 2020 to 2032 – split by type of material
Table 75: Production in Italy from 2020 to 2032 – split by type of material
Table 76: Revenues generated in Spain from 2020 to 2032 in billion USD and billion EUR
Table 77: Demand in Spain from 2020 to 2032 – split by application
Table 78: Demand in Spain from 2020 to 2032 – split by type of material
Table 79: Production in Spain from 2020 to 2032 – split by type of material
Table 80: Revenues generated in the United Kingdom from 2020 to 2032 in billion USD and billion EUR
Table 81: Demand in the United Kingdom from 2020 to 2032 – split by application
Table 82: Demand in the United Kingdom from 2020 to 2032 – split by type of material
Table 83: Production in the United Kingdom from 2020 to 2032 – split by type of material
Table 84: Revenue in the remaining countries of Western Europe from 2020 to 2032 in billion USD and billion EUR
Table 85: Demand in the remaining countries of Western Europe from 2020 to 2032 – split by application
Table 86: Demand in the remaining countries of Western Europe from 2020 to 2032 – split by type of material
Table 87: Production in the remaining countries of Western Europe from 2020 to 2032 – split by type of material
Table 88: Revenues generated in Poland from 2020 to 2032 in billion USD and billion EUR
Table 89: Demand in Poland from 2020 to 2032 – split by application
Table 90: Demand in Poland from 2020 to 2032 – split by type of material
Table 91: Production in Poland from 2020 to 2032 – split by type of material
Table 92: Revenues generated in Russia from 2020 to 2032 in billion USD and billion EUR
Table 93: Demand in Russia from 2020 to 2032 – split by application
Table 94: Demand in Russia from 2020 to 2032 – split by type of material
Table 95: Production in Russia from 2020 to 2032 – split by type of material
Table 96: Revenues generated in Turkey from 2020 to 2032 in billion USD and billion EUR
Table 97: Demand in Turkey from 2020 to 2032 – split by application
Table 98: Demand in Turkey from 2020 to 2032 – split by type of material
Table 99: Production in Turkey from 2020 to 2032 – split by type of material
Table 100: Revenues in the remaining countries of Eastern Europe from 2020 to 2032 in billion USD and billion EUR
Table 101: Demand in the remaining countries of Eastern Europe from 2020 to 2032 – split by application
Table 102: Demand in the remaining countries of Eastern Europe from 2020 to 2032 – split by type of material
Table 103: Production in the remaining countries of Eastern Europe from 2020 to 2032 – split by type of material
Table 104: Revenues in Canada from 2020 to 2032 in billion USD and billion EUR
Table 105: Demand in Canada from 2020 to 2032 – split by application
Table 106: Demand in Canada from 2020 to 2032 – split by type of material
Table 107: Production in Canada from 2020 to 2032 – split by type of material
Table 108: Revenues in Mexico from 2020 to 2032 in billion USD and billion EUR
Table 109: Demand in Mexico from 2020 to 2032 – split by application
Table 110: Demand in Mexico from 2020 to 2032 – split by type of material
Table 111: Production in Mexico from 2020 to 2032 – split by type of material
Table 112: Revenues in the USA from 2020 to 2032 in billion USD and billion EUR
Table 113: Demand in the USA from 2020 to 2032 – split by application
Table 114: Demand in the USA from 2020 to 2032 – split by type of material
Table 115: Production in the USA from 2020 to 2032 – split by type of material
Table 116: Revenues generated in Argentina from 2020 to 2032 in billion USD and billion EUR
Table 117: Demand in Argentina from 2020 to 2032 – split by application
Table 118: Demand in Argentina from 2020 to 2032 – split by type of material
Table 119: Production in Argentina from 2020 to 2032 – split by type of material
Table 120: Revenues generated in Brazil from 2020 to 2032 in billion USD and billion EUR
Table 121: Demand in Brazil from 2020 to 2032 – split by application
Table 122: Demand in Brazil from 2020 to 2032 – split by type of material
Table 123: Production in Brazil from 2020 to 2032 – split by type of material
Table 124: Revenues generated in the remaining countries of South America from 2020 to 2032 in billion USD and billion EUR
Table 125: Demand in the remaining countries of South America from 2020 to 2032 – split by application
Table 126: Demand in the remaining countries of South America from 2020 to 2032 – split by type of material
Table 127: Production in the remaining countries of South America from 2020 to 2032 – split by type of material
Table 128: Revenues in China from 2020 to 2032 in billion USD and billion EUR
Table 129: Demand in China from 2020 to 2032 – split by application
Table 130: Demand in China from 2020 to 2032 – split by type of material
Table 131: Production in China from 2020 to 2032 – split by type of material
Table 132: Revenues in India from 2020 to 2032 in billion USD and billion EUR
Table 133: Demand in India from 2020 to 2032 – split by application
Table 134: Demand in India from 2020 to 2032 – split by type of material
Table 135: Production in India from 2020 to 2032 – split by type of material
Table 136: Revenues in Japan from 2020 to 2032 in billion USD and billion EUR
Table 137: Demand in Japan from 2020 to 2032 – split by application
Table 138: Demand in Japan from 2020 to 2032 – split by type of material
Table 139: Production in Japan from 2020 to 2032 – split by type of material
Table 140: Revenues in South Korea from 2020 to 2032 in billion USD and billion EUR
Table 141: Demand in South Korea from 2020 to 2032 – split by application
Table 142: Demand in South Korea from 2020 to 2032 – split by type of material
Table 143: Production in South Korea from 2020 to 2032 – split by type of material
Table 144: Revenues in Thailand from 2020 to 2032 in billion USD and billion EUR
Table 145: Demand in Thailand from 2020 to 2032 – split by application
Table 146: Demand in Thailand from 2020 to 2032 – split by type of material
Table 147: Production in Thailand from 2020 to 2032 – split by type of material
Table 148: Revenues generated the remaining countries of Asia-Pacific from 2020 to 2032 in million USD and million EUR
Table 149: Demand in the remaining countries of Asia-Pacific from 2020 to 2032 – split by application
Table 150: Demand in the remaining countries of Asia-Pacific from 2020 to 2032 – split by type of material
Table 151: Production in the remaining countries of Asia-Pacific from 2020 to 2032 – split by type of material


