

Description
The Plastic Films Market Report – Europe is now also available in parts (e.g. individual country profiles or all manufacturer profiles). Please feel free to contact us and we will immediately send you an offer for your specific selection.
Are sophisticated specialty products the future of European industry? Demand is increasing for films and plastic packaging with special properties. In many European countries, however, the production of plastic films is becoming less and less competitive compared to other regions of the world, and the consumption of plastic carrier bags is continuing to decline. Ceresana has now analyzed the entire European market for plastic films for the third time. The company’s market researchers forecast that plastic film demand in Europe will grow to around 13.8 million tonnes by 2033.
Challenges for Plastic Film Manufacturers
Demand for plastic films is increasing overall. However, crises and inflation are affecting consumer sentiment in large parts of Europe – and therefore also the market for packaging materials. In addition, the EU plastics own resource (“plastic tax”) and the new EU Packaging and Packaging Waste Regulation (PPWR) as well as an increasing maze of national and in some cases even municipal regulations aim to reduce packaging waste. Disposable sacks and shirt bags made from plastics are often replaced by paper bags or eliminated altogether. However, films are not only used to make bags, but also packaging films, shrink and stretch films, agricultural films, and construction films, for example. Specialized applications in industry include adhesive films, battery films, and insulating films. The demand for bags and sacks made from PE films is decreasing. However, the new European plastic film market report by Ceresana also covers the markets for polypropylene films, PET films, and PVC films, which are increasingly available in bio-based variants. Other types of plastic films, such as polystyrene films, polyamide films, or bioplastic films (e.g. PLA films), are analyzed as an aggregate.
In defining films, sheets, and boards, all products from wafer-thin films to thick, rigid boards can be found. The focus of this study is on flexible films. Sheets and boards used e.g. in the manufacture of rigid packaging such as boxes, cartons, and crates are not considered here. Rigid sheets and panels utilized in construction and industrial applications are not included either.
Trend Towards Ultra-Thin High-Tech Films
Agricultural films are recording above-average growth: In various European countries, efforts to intensify agriculture, forestry, and horticulture are increasing the use of wrapping films, silage films, mulch films, anti-dew films, greenhouse films, and other innovative solutions. Plants increasingly need to be protected against extreme weather events. The demand for protective and functional films is also growing in the construction industry, for example for vapor barriers or as part of high-performance insulation materials. The consumption of construction films follows the order situation of the respective construction industry. In contrast, demand for secondary and transport packaging such as shrink and stretch films depends on the macroeconomic development and the consumer climate. In addition to market data, forecasts, and company profiles, the plastic film market report also provides background information on the regulatory framework in the EU as well as the economic situation and the situation in the packaging industry in the individual European countries. This includes information on market size, recycling rates, and major companies in the packaging industry. The zeal with which EU regulations are implemented varies from country to country. The various factors that determine the complex market for plastic films are analyzed in detail in the respective country profiles (chapters 2.1 to 2.21).
Current Market Study “Plastic Films – Europe”:
Chapter 1 analyzes the total European demand for and production of plastic films (in 1,000 tonnes) as well as revenues generated with plastic films (in billion US-dollars and billion euros). In addition, the production and demand volumes of plastic films are broken down for the various types of plastic. The film consumption of the various application areas is also examined.
Chapter 2 presents a detailed analysis of the plastic films market size and growth in 21 European countries: Demand, revenues, and production are each considered individually.
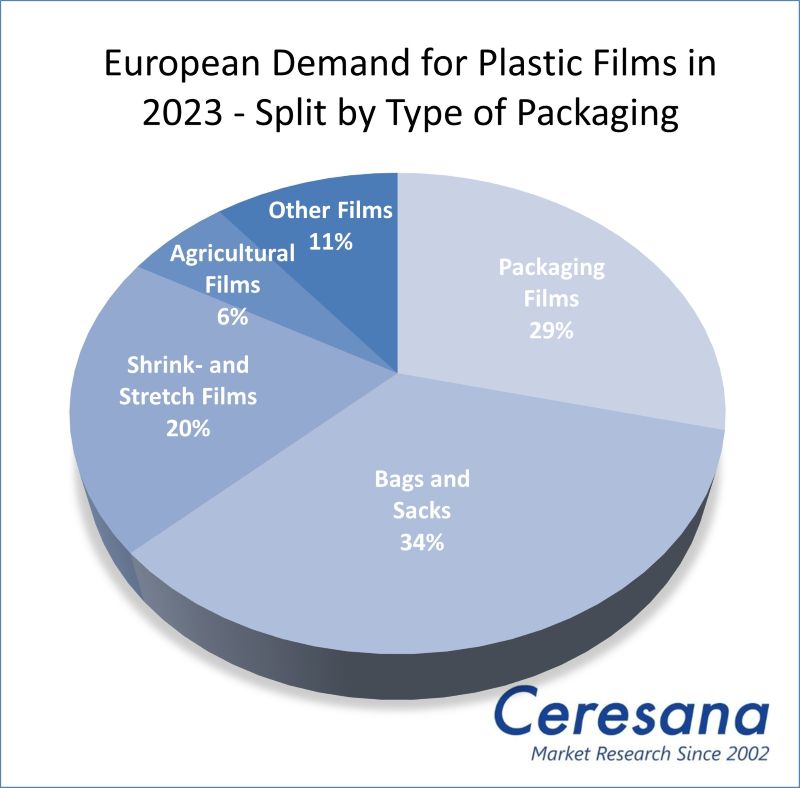
In addition, plastic film demand (in tonnes) is divided into 5 application areas:
- Packaging films
- Bags and sacks
- Shrink and stretch films
- Agricultural films
- Other films
Production and demand are also broken down for 5 types of plastic:
- PE (LDPE, LLDPE, HDPE)
- PP
- PET
- PVC
- Other plastics
Chapter 3 provides company profiles of the most important plastic film manufacturers – clearly arranged according to contact details, revenues, net income, product range, production sites, and profile summary. Detailed profiles of 81 manufacturers are provided, such as Amcor Ltd., Toray Industries Europe GmbH, Covestro AG, Sealed Air Corporation, Mondi Group, Constantia Flexibles Group GmbH, UFLEX Europe Ltd., and Coveris Management GmbH.
=> Ceresana regularly analyzes the European and global markets for plastics and plastic products. Individual types of plastic are just as much a topic for in-depth Ceresana studies as, for example, plastic pipes or films made from bioplastics. Current Ceresana market studies are available on various packaging materials, such as plastic closures, plastic containers, flexible and rigid plastic packaging, and also on possible alternatives to plastics such as metal, corrugated board, or cardboard. Market analyses of labels, adhesives, and printing inks are also relevant for the packaging industry. Special market studies by Ceresana analyze food packaging as well as packaging for cosmetics and personal care products. A particular focus of Ceresana’s market research is on bio-based products made from renewable raw materials. Ceresana also organizes online events on the bio-economy, for example on bioplastics and bio-based packaging.
Scope of the Report:
Attributes | Details |
| Base Year | 2023 |
| Trend Period | 2021 – 2033 |
| Forecast Period | 2024 – 2033 |
| Pages | 350 |
| Application Areas | Packaging films, bags & sacks, shrink & stretch films, agricultural films, other films |
| Types of Plastic | PE (LDPE, LLDPE, HDPE), PP, PET, PVC, other plastics |
| Company Profiles | Amcor, Toray, Covestro, Sealed Air, Mondi, Constantia, UFLEX, and Coveris (Selection) |
| Edition | 3rd edition |
| Publication | August 2025 |
FAQs
How will the market for plastic films in Europe develop until 2033?
Ceresana forecasts that plastic film demand in Europe will grow to around 13.8 million tonnes by 2033.
Which application area will see the most dynamic growth in the coming years?
The agricultural film segment will experience above-average growth until 2033.
1 Market Data: Europe
1.1 Demand
1.2 Revenues
1.3 Production
1.4 Demand Split by Application
1.4.1 Packaging Films
1.4.2 Bags and Sacks
1.4.3 Shrink and Stretch Films
1.4.4 Agricultural Films
1.4.5 Other Films
1.5 Demand Split by Type of Plastic
1.5.1 Polyethylene (PE)
1.5.2 Polypropylene (PP)
1.5.3 Polyethylene Terephthalate (PET)
1.5.4 Polyvinyl Chloride (PVC)
1.5.5 Other Plastics
1.6 Production Split by Type of Plastic
1.6.1 PE
1.6.1.1 LDPE
1.6.1.2 LLDPE
1.6.1.3 HDPE
1.6.2 PP
1.6.3 PET
1.6.4 PVC
1.6.5 Other Plastics
1.7 Excursus: Bioplastic Films
1.7.1 Definitions and Characteristics of Bioplastics
1.7.2 Bioplastics for Films
1.8 Excursus: Regulations and Directives in the European Union (EU)
1.8.1 General Information
1.8.2 Packaging Industry
2 Market Data: Country Profiles
(For each country: demand split by application and type of plastic, production split by type of plastic)
2.1 Austria
2.1.1 Demand and Revenues
2.1.2 Production
2.2 Belgium
2.2.1 Demand and Revenues
2.2.2 Production
2.3 Czechia
2.3.1 Demand and Revenues
2.3.2 Production
2.4 Denmark
2.4.1 Demand and Revenues
2.4.2 Production
2.5 Finland
2.5.1 Demand and Revenues
2.5.2 Production
2.6 France
2.6.1 Demand and Revenues
2.6.2 Production
2.7 Germany
2.7.1 Demand and Revenues
2.7.2 Production
2.8 Greece
2.8.1 Demand and Revenues
2.8.2 Production
2.9 Hungary
2.9.1 Demand and Revenues
2.9.2 Production
2.10 Italy
2.10.1 Demand and Revenues
2.10.2 Production
2.11 Norway
2.11.1 Demand and Revenues
2.11.2 Production
2.12 Poland
2.12.1 Demand and Revenues
2.12.2 Production
2.13 Portugal
2.13.1 Demand and Revenues
2.13.2 Production
2.14 Romania
2.14.1 Demand and Revenues
2.14.2 Production
2.15 Russia
2.15.1 Demand and Revenues
2.15.2 Production
2.16 Spain
2.16.1 Demand and Revenues
2.16.2 Production
2.17 Sweden
2.17.1 Demand and Revenues
2.17.2 Production
2.18 Switzerland
2.18.1 Demand and Revenues
2.18.2 Production
2.19 The Netherlands
2.19.1 Demand and Revenues
2.19.2 Production
2.20 Türkiye
2.20.1 Demand and Revenues
2.20.2 Production
2.21 United Kingdom
2.21.1 Demand and Revenues
2.21.2 Production
2.22 Rest of Europe
2.22.1 Demand and Revenues
2.22.2 Production
3 Company Profiles*
Austria (3 Producers)
Bulgaria (4)
Croatia (2)
Cyprus (1)
Czech Republic (3)
Estonia (1)
Finland (2)
France (5)
Germany (16)
Greece (3)
Italy (10)
Luxembourg (1)
Poland (3)
Portugal (1)
Romania (1)
Russia (1)
Slovakia (1)
Spain (4)
Sweden (1)
Switzerland (2)
The Netherlands (3)
Türkiye (3)
United Kingdom (10)
*Note: The profiles are assigned to the country in which the company or holding is headquartered. Profiles also include JVs and subsidiaries.
Graph 1: Demand in Europe from 2021 to 2033
Graph 2: Revenues generated in Europe from 2021 to 2033 in billion USD and billion EUR
Graph 3: Production in Europe from 2021 to 2033
Graph 4: Global demand for bioplastic films in 2022
Graph 5: Demand in Austria from 2021 to 2033
Graph 6: Production in Austria from 2021 to 2033
Graph 7: Demand in Belgium from 2021 to 2033
Graph 8: Production in Belgium from 2021 to 2033
Graph 9: Demand in Czechia from 2021 to 2033
Graph 10: Production in Czechia from 2021 to 2033
Graph 11: Demand in Denmark from 2021 to 2033
Graph 12: Production in Denmark from 2021 to 2033
Graph 13: Demand in Finland from 2021 to 2033
Graph 14: Production in Finland from 2021 to 2033
Graph 15: Demand in France from 2021 to 2033
Graph 16: Production in France from 2021 to 2033
Graph 17: Demand in Germany from 2021 to 2033
Graph 18: Production in Germany from 2021 to 2033
Graph 19: Demand in Greece from 2021 to 2033
Graph 20: Production in Greece from 2021 to 2033
Graph 21: Demand in Hungary from 2021 to 2033
Graph 22: Production in Hungary from 2021 to 2033
Graph 23: Demand in Italy from 2021 to 2033
Graph 24: Production in Italy from 2021 to 2033
Graph 25: Demand in Norway from 2021 to 2033
Graph 26: Production in Norway from 2021 to 2033
Graph 27: Demand in Poland from 2021 to 2033
Graph 28: Production in Poland from 2021 to 2033
Graph 29: Demand in Portugal from 2021 to 2033
Graph 30: Production in Portugal from 2021 to 2033
Graph 31: Demand in Romania from 2021 to 2033
Graph 32: Production in Romania from 2021 to 2033
Graph 33: Demand in Russia from 2021 to 2033
Graph 34: Production in Russia from 2021 to 2033
Graph 35: Demand in Spain from 2021 to 2033
Graph 36: Production in Spain from 2021 to 2033
Graph 37: Demand in Sweden from 2021 to 2033
Graph 38: Production in Sweden from 2021 to 2033
Graph 39: Demand in Switzerland from 2021 to 2033
Graph 40: Production in Switzerland from 2021 to 2033
Graph 41: Demand in the Netherlands from 2021 to 2033
Graph 42: Production in the Netherlands from 2021 to 2033
Graph 43: Demand in Türkiye from 2021 to 2033
Graph 44: Production in Türkiye from 2021 to 2033
Graph 45: Demand in the United Kingdom from 2021 to 2033
Graph 46: Production in the United Kingdom from 2021 to 2033
Graph 47: Demand in the remaining countries of Europe from 2021 to 2033
Graph 48: Production in the remaining countries of Europe from 2021 to 2033
Table 1: Demand in Europe from 2021 to 2033 – split by country
Table 2: Production in Europe from 2021 to 2033 – split by country
Table 3: Demand in Europe from 2021 to 2033 – split by application
Table 4: Demand in the “packaging films” segment in Europe from 2021 to 2033 – split by country
Table 5: Demand in the “bags & sacks” segment in Europe from 2021 to 2033 – split by country
Table 6: Demand in the “shrink & stretch films” segment in Europe from 2021 to 2033 – split by country
Table 7: Demand in the “agricultural films” segment in Europe from 2021 to 2033 – split by country
Table 8: Demand in the “other films” segment in Europe from 2021 to 2033 – split by country
Table 9: Demand in Europe from 2021 to 2033 – split by type of plastic
Table 10: Demand for “polyethylene films” in Europe from 2021 to 2033 – split by country
Table 11: Demand for “polypropylene films” in Europe from 2021 to 2033 – split by country
Table 12: Demand for “PET films” in Europe from 2021 to 2033 – split by country
Table13: Demand for “PVC films” in Europe from 2021 to 2033 – split by country
Table 14: Demand for “films made from other plastics” in Europe from 2021 to 2033 – split by country
Table 15: Production in Europe from 2021 to 2033 – split by type of plastic
Table 16: Production of “polyethylene films” in Europe from 2021 to 2033 – split by country
Table 17: Production of “LDPE films” in Europe from 2021 to 2033 – split by country
Table18: Production of “LLDPE films” in Europe from 2021 to 2033 – split by country
Table19: Production of “HDPE films” in Europe from 2021 to 2033 – split by country
Table 20: Production of “polypropylene films” in Europe from 2021 to 2033 – split by country
Table 21: Production of “PET films” in Europe from 2021 to 2033 – split by country
Table 22: Production of “PVC films” in Europe from 2021 to 2033 – split by country
Table 23: Production of “films made from other plastics” in Europe from 2021 to 2033 – split by country
Table 24: Revenues generated in Austria from 2021 to 2033, in million USD and million EUR
Table 25: Demand in Austria from 2021 to 2033 – split by application
Table 26: Demand in Austria from 2021 to 2033 – split by type of plastic
Table 27: Production in Austria from 2021 to 2033 – split by type of plastic
Table 28: Revenues generated in Belgium from 2021 to 2033, in million USD and million EUR
Table 29: Demand in Belgium from 2021 to 2033 – split by application
Table 30: Demand in Belgium from 2021 to 2033 – split by type of plastic
Table 31: Production in Belgium from 2021 to 2033 – split by type of plastic
Table 32: Revenues generated in Czechia from 2021 to 2033, in million USD and million EUR
Table 33: Demand in Czechia from 2021 to 2033 – split by application
Table 34: Demand in Czechia from 2021 to 2033 – split by type of plastic
Table 35: Production in Czechia from 2021 to 2033 – split by type of plastic
Table 36: Revenues generated in Denmark from 2021 to 2033, in million USD and million EUR
Table 37: Demand in Denmark from 2021 to 2033 – split by application
Table 38: Demand in Denmark from 2021 to 2033 – split by type of plastic
Table 39: Production in Denmark from 2021 to 2033 – split by type of plastic
Table 40: Revenues generated in Finland from 2021 to 2033, in million USD and million EUR
Table 41: Demand in Finland from 2021 to 2033 – split by application
Table 42: Demand in Finland from 2021 to 2033 – split by type of plastic
Table 43: Production in Finland from 2021 to 2033 – split by type of plastic
Table 44: Revenues generated in France from 2021 to 2033, in million USD and million EUR
Table 45: Demand in France from 2021 to 2033 – split by application
Table 46: Demand in France from 2021 to 2033 – split by type of plastic
Table 47: Production in France from 2021 to 2033 – split by type of plastic
Table 48: Revenues generated in Germany from 2021 to 2033, in million USD and million EUR
Table49: Demand in Germany from 2021 to 2033 – split by application
Table50: Demand in Germany from 2021 to 2033 – split by type of plastic
Table 51: Production in Germany from 2021 to 2033 – split by type of plastic
Table 52: Revenues generated in Greece from 2021 to 2033, in million USD and million EUR
Table 53: Demand in Greece from 2021 to 2033 – split by application
Table 54: Demand in Greece from 2021 to 2033 – split by type of plastic
Table 55: Production in Greece from 2021 to 2033 – split by type of plastic
Table 56: Revenues generated in Hungary from 2021 to 2033, in million USD and million EUR
Table 57: Demand in Hungary from 2021 to 2033 – split by application
Table 58: Demand in Hungary from 2021 to 2033 – split by type of plastic
Table 59: Production in Hungary from 2021 to 2033 – split by type of plastic
Table 60: Revenues generated in Italy from 2021 to 2033, in million USD and million EUR
Table 61: Demand in Italy from 2021 to 2033 – split by application
Table 62: Demand in Italy from 2021 to 2033 – split by type of plastic
Table 63: Production in Italy from 2021 to 2033 – split by type of plastic
Table64: Revenues generated in Norway from 2021 to 2033, in million USD and million EUR
Table 65: Demand in Norway from 2021 to 2033 – split by application
Table 66: Demand in Norway from 2021 to 2033 – split by type of plastic
Table 67: Production in Norway from 2021 to 2033 – split by type of plastic
Table 68: Revenues generated in Poland from 2021 to 2033, in million USD and million EUR
Table 69: Demand in Poland from 2021 to 2033 – split by application
Table 70: Demand in Poland from 2021 to 2033 – split by type of plastic
Table 71: Production in Poland from 2021 to 2033 – split by type of plastic
Table 72: Revenues generated in Portugal from 2021 to 2033, in million USD and million EUR
Table 73: Demand in Portugal from 2021 to 2033 – split by application
Table 74: Demand in Portugal from 2021 to 2033 – split by type of plastic
Table 75: Production in Portugal from 2021 to 2033 – split by type of plastic
Table 76: Revenues generated in Romania from 2021 to 2033, in million USD and million EUR
Table 77: Demand in Romania from 2021 to 2033 – split by application
Table 78: Demand in Romania from 2021 to 2033 – split by type of plastic
Table 79: Production in Romania from 2021 to 2033 – split by type of plastic
Table 80: Revenues generated in Russia from 2021 to 2033, in million USD and million EUR
Table 81: Demand in Russia from 2021 to 2033 – split by application
Table 82: Demand in Russia from 2021 to 2033 – split by type of plastic
Table 83: Production in Russia from 2021 to 2033 – split by type of plastic
Table84: Revenues generated in Spain from 2021 to 2033, in million USD and million EUR
Table 85: Demand in Spain from 2021 to 2033 – split by application
Table 86: Demand in Spain from 2021 to 2033 – split by type of plastic
Table 87: Production in Spain from 2021 to 2033 – split by type of plastic
Table 88: Revenues generated in Sweden from 2021 to 2033, in million USD and million EUR
Table 89: Demand in Sweden from 2021 to 2033 – split by application
Table 90: Demand in Sweden from 2021 to 2033 – split by type of plastic
Table 91: Production in Sweden from 2021 to 2033 – split by type of plastic
Table 92: Revenues generated in Switzerland from 2021 to 2033, in million USD and million EUR
Table 93: Demand in Switzerland from 2021 to 2033 – split by application
Table 94: Demand in Switzerland from 2021 to 2033 – split by type of plastic
Table 95: Production in Switzerland from 2021 to 2033 – split by type of plastic
Table 96: Revenues generated in the Netherlands from 2021 to 2033, in million USD and million EUR
Table 97: Demand in the Netherlands from 2021 to 2033 – split by application
Table 98: Demand in the Netherlands from 2021 to 2033 – split by type of plastic
Table 99: Production in the Netherlands from 2021 to 2033 – split by type of plastic
Table 100: Revenues generated in Türkiye from 2021 to 2033, in million USD and million EUR
Table 101: Demand in Türkiye from 2021 to 2033 – split by application
Table 102: Demand in Türkiye from 2021 to 2033 – split by type of plastic
Table 103: Production in Türkiye from 2021 to 2033 – split by type of plastic
Table 104: Revenues generated in the United Kingdom from 2021 to 2033, in million USD and million EUR
Table 105: Demand in the United Kingdom from 2021 to 2033 – split by application
Table 106: Demand in the United Kingdom from 2021 to 2033 – split by type of plastic
Table 107: Production in the United Kingdom from 2021 to 2033 – split by type of plastic
Table 108: Revenues generated in the remaining countries of Europe from 2021 to 2033, in million USD and million EUR
Table 109: Demand in the remaining countries of Europe from 2021 to 2033 – split by application
Table 110: Demand in the remaining countries of Europe from 2021 to 2033 – split by type of plastic
Table111: Production in the remaining countries of Europe from 2021 to 2033 – split by type of plastic


