

Description
Are you interested in an updated edition? Then please indicate the desired publication date and content in the form. We look forward to responding to you promptly.
The Food Packaging Market Report – Europe is now also available in parts (e.g. individual country profiles or all manufacturer profiles). Please feel free to contact us and we will immediately send you an offer for your specific selection.
Defying the trend, food retail revenues increased in many countries during the pandemic, as restaurants were closed and consumers had plenty of time to cook for themselves. Now, people are increasingly cutting back on food to offset the burden of higher energy costs. However, demand for food packaging continues to grow, albeit at a slower pace and not in all areas. For the second time, Ceresana has analyzed the European market for food packaging in all categories except beverages. The new study takes into account not only films, pouches, cans, tubes, jars and other primary packaging, but also secondary and transport packaging. Ceresana analysts expect total demand for food packaging in Europe to reach a volume of around 41.7 million tonnes by 2031.
More Bioplastics, Less Glass
The various packaging materials and types of packaging are developing at different paces: while canned goods were hoarded during the lockdown, demand for metal packaging is now declining again. One exception, however, is tubes, the consumption of which is growing in many places. Packaging that is considered environmentally friendly, such as Bioplastics, but also paper bags and packaging made from recycled plastics, is particularly benefiting from the sustainability trend and the upswing in organic food. In the case of packaging films and short-lived disposable food packaging, bioplastics score points with their biodegradability. Glass packaging, on the other hand, may have a green image, but the demand for container glass is nevertheless continuing to decline. Convenience is important to producers and consumers alike: online retailing and shipping packaging are increasing demand for corrugated cardboard and the trend towards shelf-ready packaging favors food packaging made of paper and cardboard.
Innovative Packaging, New Technologies
Sales of fresh baked goods, fresh meat and fish are barely increasing. The strongest growth in the food market is currently being seen in breakfast cereals, ready meals, chilled and frozen foods. Convenience products are a particular challenge for packaging manufacturers, because transport and storage times are becoming longer and longer, and with them the desired shelf-life periods – but at the same time, packaging should be attractive, practical and recyclable, whilst also being lighter and more cost-effective if possible. The packaging industry is responding to the complex requirements with innovative materials and technologies: in order to further reduce packaging weight and the use of resources, stand-up pouches are being used in more and more areas. The shelf life of food can be increased by changing the gas composition within the packaging. High-barrier films are required for modified atmosphere packaging (MAP). In the case of plastic films for primary packaging, Ceresana’s market researchers are registering particularly strong growth in BOPET films.
Market Study in Brief:
Chapter 1 analyzes the European demand for food packaging, including Russia and Turkey. All data regarding demand for food packaging is given in 1,000 tonnes.
A distinction is made between plastics, paper, cardboard and corrugated cardboard, metal and glass. In addition, the demand is analyzed according to 16 packaging types:
- Plastic:
- Packaging films (primary packaging)
- Bags & sacks
- Shrink & stretch films
- Rigid containers
- Caps & closures
- Paper & Cardboard, including corrugated cardboard:
- Bags & sacks
- Labels
- Other packaging paper
- Corrugated cardboard
- Solid cardboard
- Metal:
- Cans
- Tubes
- Other containers
- Caps & closures
- Films & barrier layers
- Glass
Chapter 2 provides reliable data on the consumption of food packaging for 22 individual countries. The various materials, packaging types and areas of application are examined in detail.
The various plastic packaging types are further subdivided for the 8 largest markets in Europe (Germany, France, United Kingdom, Italy, Poland, Russia, Spain and Turkey) according to the type of plastic used:
- Packaging films:
- Polyethylene
- Polypropylene
- PET
- Other plastics
- Bags & sacks:
- Polyethylene
- Other plastics
- Shrink & stretch films:
- Polyethylene
- Other plastics
- Rigid containers:
- Polyethylene
- Polypropylene
- PET
- Other plastics
- Caps & closures:
- Polyethylene
- Other plastics
The demand for food packaging is examined for up to 12 areas of application, depending on the manufacturing material:
- Spreads
- Baked goods
- Ready-made meals
- Meat & fish
- Breakfast cereals
- Chilled food
- Canned and preserved food
- Dairy products
- Fruit & vegetables
- Sauces & condiments
- Confectionery
- Dry food
- Other applications
Chapter 3 provides useful company profiles of the most important manufacturers of food packaging. They are clearly arranged by contact details, revenues, profits, product range, production sites, brief profile as well as product types and application areas. Detailed profiles are provided by 86 manufacturers, such as Amcor Ltd., Auxiliar Conservera S.A., Berry Plastics Corporation, Coveris Holding S.A., DS SMITH plc, Karatzis SA, Sealed Air Corporation, Smurfit Kappa Group PLC, Sonoco Products Co., Ltd., and Tetra Pak International S.A.
→ Beverages are not considered in this study. However, Ceresana offers a number of other market studies relevant to the beverage industry such as plastic bottles, rigid metal containers, closures, and labels.
Scope of the Report:
Attributes | Details |
| Base Year | 2021 |
| Trend Period | 2019 – 2031 |
| Forecast Period | 2022- 2031 |
| Pages | 430 |
| Materials | Plastic, Paper & Cardboard, Metal, Glass |
| Application Areas | Spreads, Baked goods, Prepared foods, Meat & fish, Breakfast cereals, Refrigerated foods, Canned foods, Dairy products, Fruit & vegetables, Sauces & condiments, Confectionery, Dried foods, Other applications |
| Company Profiles | Amcor, Auxiliar Conservera, Berry, Coveris, DS SMITH, Karatzis, Sealed Air, Smurfit Kappa, Sonoco and Tetra Pak. (selection) |
| Edition | 2nd edition |
| Publication | October 2022 |
FAQs
How high is the european consumption of food packaging expected to be by 2031?
We expect total demand for food packaging in Europe to reach a volume of around 41.7 million tonnes by 2031.
In which application areas is the demand for food packaging expected to increase the most?
The strongest growth in the food market is currently being seen in breakfast cereals, ready meals, chilled and frozen foods.
1 Market Data: Europe
1.1 Demand
1.2 Applications
1.2.1 Spreads
1.2.2 Baked Goods
1.2.3 Ready-made Meals
1.2.4 Fresh Meat and Fish
1.2.5 Breakfast Cereals
1.2.6 Chilled & Frozen Food
1.2.7 Canned Food
1.2.8 Dairy Products
1.2.9 resh Fruits and Vegetables
1.2.10 Sauces and Condiments
1.2.11 Confectionery and Snacks
1.2.12 Dry Food
1.2.13 Other Applications
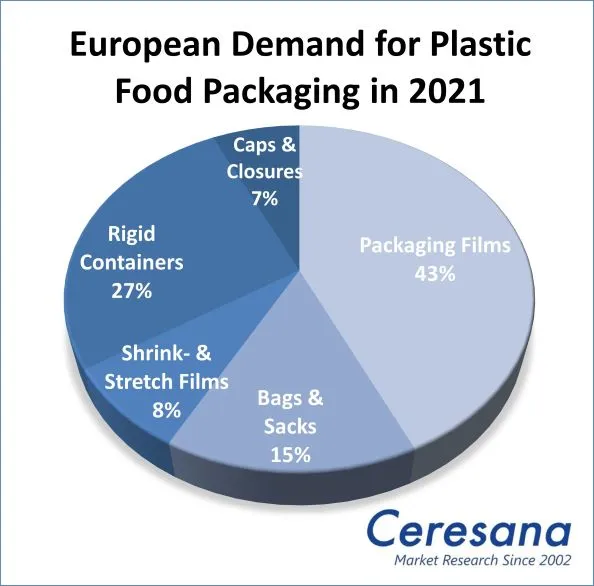
1.3 Packaging Made of Plastics
1.3.1 Films (Primary Packaging)
1.3.2 Bag Packaging
1.3.3 Shrink and Stretch Films
1.3.4 Rigid Containers
1.3.5 Caps and Closures
1.4 Packaging Made of Paper and Cardboard
1.4.1 Bags & Sacks
1.4.2 Labels
1.4.3 Other Papers
1.4.4 Packaging Made of Corrugated Board
1.4.5 Packaging Made of Solid Board
1.5 Packaging Made of Metal
1.5.1 Cans
1.5.2 Tubes
1.5.3 Other Containers
1.5.4 Caps and Closures
1.5.5 Film
1.6 Packaging Made of Glass
2 Market Data: Countries
2.1 Austria
2.1.1 Food Packaging
2.1.2 Food Packaging – Plastics
2.1.3 Food Packaging – Paper & Cardboard
2.1.4 Food Packaging – Metal
2.1.5 Food Packaging – Glass
2.2 Belgium
2.2.1 Food Packaging
2.2.2 Food Packaging – Plastics
2.2.3 Food Packaging – Paper & Cardboard
2.2.4 Food Packaging – Metal
2.2.5 Food Packaging – Glass
2.3 Bulgaria
2.3.1 Food Packaging
2.3.2 Food Packaging – Plastics
2.3.3 Food Packaging – Paper & Cardboard
2.3.4 Food Packaging – Metal
2.3.5 Food Packaging – Glass
2.4 Czechia
2.4.1 Food Packaging
2.4.2 Food Packaging – Plastics
2.4.3 Food Packaging – Paper & Cardboard
2.4.4 Food Packaging – Metal
2.4.5 Food Packaging – Glass
2.5 Finland
2.5.1 Food Packaging
2.5.2 Food Packaging – Plastics
2.5.3 Food Packaging – Paper & Cardboard
2.5.4 Food Packaging – Metal
2.5.5 Food Packaging – Glass
2.6 France
2.6.1 Food Packaging
2.6.2 Food Packaging – Plastics
2.6.3 Food Packaging – Paper & Cardboard
2.6.4 Food Packaging – Metal
2.6.5 Food Packaging – Glass
2.7 Germany
2.7.1 Food Packaging
2.7.2 Food Packaging – Plastics
2.7.3 Food Packaging – Paper & Cardboard
2.7.4 Food Packaging – Metal
2.7.5 Food Packaging – Glass
2.8 Greece
2.8.1 Food Packaging
2.8.2 Food Packaging – Plastics
2.8.3 Food Packaging – Paper & Cardboard
2.8.4 Food Packaging – Metal
2.8.5 Food Packaging – Glass
2.9 Hungary
2.9.1 Food Packaging
2.9.2 Food Packaging – Plastics
2.9.3 Food Packaging – Paper & Cardboard
2.9.4 Food Packaging – Metal
2.9.5 Food Packaging – Glass
2.10 Italy
2.10.1 Food Packaging
2.10.2 Food Packaging – Plastics
2.10.3 Food Packaging – Paper & Cardboard
2.10.4 Food Packaging – Metal
2.10.5 Food Packaging – Glass
2.11 Lithuania
2.11.1 Food Packaging
2.11.2 Food Packaging – Plastics
2.11.3 Food Packaging – Paper & Cardboard
2.11.4 Food Packaging – Metal
2.11.5 Food Packaging – Glass
2.12 Norway
2.12.1 Food Packaging
2.12.2 Food Packaging – Plastics
2.12.3 Food Packaging – Paper & Cardboard
2.12.4 Food Packaging – Metal
2.12.5 Food Packaging – Glass
2.13 Poland
2.13.1 Food Packaging
2.13.2 Food Packaging – Plastics
2.13.3 Food Packaging – Paper & Cardboard
2.13.4 Food Packaging – Metal
2.13.5 Food Packaging – Glass
2.14 Portugal
2.14.1 Food Packaging
2.14.2 Food Packaging – Plastics
2.14.3 Food Packaging – Paper & Cardboard
2.14.4 Food Packaging – Metal
2.14.5 Food Packaging – Glass
2.15 Romania
2.15.1 Food Packaging
2.15.2 Food Packaging – Plastics
2.15.3 Food Packaging – Paper & Cardboard
2.15.4 Food Packaging – Metal
2.15.5 Food Packaging – Glass
2.16 Russia
2.16.1 Food Packaging
2.16.2 Food Packaging – Plastics
2.16.3 Food Packaging – Paper & Cardboard
2.16.4 Food Packaging – Metal
2.16.5 Food Packaging – Glass
2.17 Sweden
2.17.1 Food Packaging
2.17.2 Food Packaging – Plastics
2.17.3 Food Packaging – Paper & Cardboard
2.17.4 Food Packaging – Metal
2.17.5 Food Packaging – Glass
2.18 Slovakia
2.18.1 Food Packaging
2.18.2 Food Packaging – Plastics
2.18.3 Food Packaging – Paper & Cardboard
2.18.4 Food Packaging – Metal
2.18.5 Food Packaging – Glass
2.19 Spain
2.19.1 Food Packaging
2.19.2 Food Packaging – Plastics
2.19.3 Food Packaging – Paper & Cardboard
2.19.4 Food Packaging – Metal
2.19.5 Food Packaging – Glass
2.20 The Netherlands
2.20.1 Food Packaging
2.20.2 Food Packaging – Plastics
2.20.3 Food Packaging – Paper & Cardboard
2.20.4 Food Packaging – Metal
2.20.5 Food Packaging – Glass
2.21 Turkey
2.21.1 Food Packaging
2.21.2 Food Packaging – Plastics
2.21.3 Food Packaging – Paper & Cardboard
2.21.4 Food Packaging – Metal
2.21.5 Food Packaging – Glass
2.23 United Kingdom
2.23.1 Food Packaging
2.23.2 Food Packaging – Plastics
2.23.3 Food Packaging – Paper & Cardboard
2.23.4 Food Packaging – Metal
2.23.5 Food Packaging – Glass
2.24 Rest of Europe
2.24.1 Food Packaging
2.24.2 Food Packaging – Plastics
2.24.3 Food Packaging – Paper & Cardboard
2.24.4 Food Packaging – Metal
2.24.5 Food Packaging – Glass
3 Company Profiles*
Austria (7 Producers)
Belgium (4)
Cyprus (1)
Czechia (1)
Denmark (1)
Finland (5)
France (5)
Germany (15)
Greece (2)
Ireland (1)
Italy (8)
Luxembourg (1)
Poland (1)
Portugal (1)
Russia (1)
San Marino (1)
Spain (3)
Sweden (3)
Switzerland (13)
The Netherlands (2)
Turkey (2)
United Kingdom (8)
*Die Profile sind dem Land zugeordnet, in dem die Firma/ Holding ihren Hauptsitz hat. Die Profile enthalten dabei auch Joint-Ventures und Tochterunternehmen.
Graph 1: Demand for food packaging in Europe from 2019 to 2031
Graph 2: Demand for food packaging in Austria from 2019 to 2031
Graph 3: Demand for food packaging in Belgium from 2019 to 2031
Graph 4: Demand for food packaging in Bulgaria from 2019 to 2031
Graph 5: Demand for food packaging in Czechia from 2019 to 2031
Graph 6: Demand for food packaging in Finland from 2019 to 2031
Graph 7: Demand for food packaging in France from 2019 to 2031
Graph 8: Demand for food packaging in Germany from 2019 to 2031
Graph 9: Demand for food packaging in Greece from 2019 to 2031
Graph 10: Demand for food packaging in Hungary from 2019 to 2031
Graph 11: Demand for food packaging in Italy from 2019 to 2031
Graph 12: Demand for food packaging in Lithuania from 2019 to 2031
Graph 13: Demand for food packaging in Norway from 2019 to 2031
Graph 14: Demand for food packaging in Poland from 2019 to 2031
Graph 15: Demand for food packaging in Portugal from 2019 to 2031
Graph 16: Demand for food packaging in Romania from 2019 to 2031
Graph 17: Demand for food packaging in Russia from 2019 to 2031
Graph 18: Demand for food packaging in Sweden from 2019 to 2031
Graph 19: Demand for food packaging in Slovakia from 2019 to 2031
Graph 20: Demand for food packaging in Spain from 2019 to 2031
Graph 21: Demand for food packaging in the Netherlands from 2019 to 2031
Graph 22: Demand for food packaging in Turkey from 2019 to 2031
Graph 23: Demand for food packaging in the United Kingdom from 2019 to 2031
Graph 24: Demand for food packaging in the remaining European countries from 2019 to 2031
Table 1: European demand for food packaging from 2019 to 2031 – split by countries
Table 2: European demand from 2019 to 2031 – split by applications
Table 3: European demand for food packaging in the segment spreads from 2019 to 2031 – split by countries
Table 4: European demand for food packaging in the segment baked goods from 2019 to 2031 – split by countries
Table 5: European demand for food packaging in the segment ready meals from 2019 to 2031 – split by countries
Table 6: European demand for food packaging in the segment meat and fish from 2019 to 2031 – split by countries
Table 7: European demand for food packaging in the segment breakfast cereals from 2019 to 2031 – split by countries
Table 8: European demand for food packaging in the segment chilled foods from 2019 to 2031 – split by countries
Table 9: European demand for food packaging in the segment canned goods from 2019 to 2031 – split by countries
Table 10: European demand for food packaging in the segment dairy products from 2019 to 2031 – split by countries
Table 11: European demand for food packaging in the segment fruit and vegetables from 2019 to 2031 – split by countries
Table 12: European demand for food packaging in the segment sauces & condiments from 2019 to 2031 – split by countries
Table 13: European demand for food packaging in the segment canned goods from 2019 to 2031 – split by countries
Table 14: European demand for food packaging in the segment dry foods from 2019 to 2031 – split by countries
Table 15: European demand for food packaging in the segment other applications from 2019 to 2031 – split by countries
Table 16: European demand for food packaging made of plastics from 2019 to 2031 – split by types of packaging
Table 17: European demand for primary packaging films made of plastics from 2019 to 2031 – split by countries
Table 18: European demand for bag packaging made of plastics used for food packaging from 2019 to 2031 – split by countries
Table 19: European demand for shrink and stretch films used for food packaging from 2019 to 2031 – split by countries
Table 20: European demand for rigid containers made of plastics used for food packaging from 2019 to 2031 – split by countries
Table 21: European demand for closures made of plastics used for food packaging from 2019 to 2031 – split by countries
Table 22: European demand for food packaging made of paper and cardboard from 2019 to 2031 – split by types of packaging
Table 23: European demand for bags & sacks made of paper and cardboard used for food packaging from 2019 to 2031 – split by countries
Table 24: European demand for labels made of paper used for food packaging from 2019 to 2031 – split by countries
Table 25: European demand for other paper used for food packaging from 2019 to 2031 – split by countries
Table 26: European demand for cardboard used for food packaging from 2019 to 2031 – split by countries
Table 27: European demand for solid board used for food packaging from 2019 to 2031 – split by countries
Table 28: European demand for food packaging made of metal from 2019 to 2031 – split by types of packaging
Table 29: European demand for cans made of metal used for food packaging from 2019 to 2031 – split by countries
Table 30: European demand for tubes made of metal used for food packaging from 2019 to 2031 – split by countries
Table 31: European demand for other containers made of metal used for food packaging from 2019 to 2031 – split by countries
Table 32: European demand for closures made of metal used for food packaging from 2019 to 2031 – split by countries
Table 33: European demand for films made of metal used for food packaging from 2019 to 2031 – split by countries
Table 34: European demand for glass used for food packaging from 2019 to 2031 – split by countries
Table 35: Demand for food packaging in Austria from 2019 to 2031 – split by applications
Table 36: Demand for food packaging made of plastics in Austria from 2019 to 2031 – split by applications
Table 37: Demand for food packaging made of plastics in Austria from 2019 to 2031 – split by types of packaging
Table 38: Demand for food packaging made of paper & cardboard in Austria from 2019 to 2031 – split by applications
Table 39: Demand for food packaging made of paper & cardboard in Austria from 2019 to 2031 – split by types of packaging
Table 40: Demand for food packaging made of metal in Austria from 2019 to 2031 – split by applications
Table 41: Demand for food packaging made of metal in Austria from 2019 to 2031 – split by types of packaging
Table 42: Demand for food packaging made of glass in Austria from 2019 to 2031 – split by applications
Table 43: Demand for food packaging in Belgium from 2019 to 2031 – split by applications
Table 44: Demand for food packaging made of plastics in Belgium from 2019 to 2031 – split by applications
Table 45: Demand for food packaging made of plastics in Belgium from 2019 to 2031 – split by types of packaging
Table 46: Demand for food packaging made of paper & cardboard in Belgium from 2019 to 2031 – split by applications
Table 47: Demand for food packaging made of paper & cardboard in Belgium from 2019 to 2031 – split by types of packaging
Table 48: Demand for food packaging made of metal in Belgium from 2019 to 2031 – split by applications
Table 49: Demand for food packaging made of metal in Belgium from 2019 to 2031 – split by types of packaging
Table 50: Demand for food packaging made of glass in Belgium from 2019 to 2031 – split by applications
Table 51: Demand for food packaging in Bulgaria from 2019 to 2031 – split by applications
Table 52: Demand for food packaging made of plastics in Bulgaria from 2019 to 2031 – split by applications
Table 53: Demand for food packaging made of plastics in Bulgaria from 2019 to 2031 – split by types of packaging
Table 54: Demand for food packaging made of paper & cardboard in Bulgaria from 2019 to 2031 – split by applications
Table 55: Demand for food packaging made of paper & cardboard in Bulgaria from 2019 to 2031 – split by types of packaging
Table 56: Demand for food packaging made of metal in Bulgaria from 2019 to 2031 – split by applications
Table 57: Demand for food packaging made of metal in Bulgaria from 2019 to 2031 – split by types of packaging
Table 58: Demand for food packaging made of glass in Bulgaria from 2019 to 2031 – split by applications
Table 59: Demand for food packaging in Czechia from 2019 to 2031 – split by applications
Table 60: Demand for food packaging made of plastics in Czechia from 2019 to 2031 – split by applications
Table 61: Demand for food packaging made of plastics in Czechia from 2019 to 2031 – split by types of packaging
Table 62: Demand for food packaging made of paper & cardboard in Czechia from 2019 to 2031 – split by applications
Table 63: Demand for food packaging made of paper & cardboard in Czechia from 2019 to 2031 – split by types of packaging
Table 64: Demand for food packaging made of metal in Czechia from 2019 to 2031 – split by applications
Table 65: Demand for food packaging made of metal in Czechia from 2019 to 2031 – split by types of packaging
Table 66: Demand for food packaging made of flass in Czechia from 2019 to 2031 – split by applications
Table 67: Demand for food packaging in Finland from 2019 to 2031 – split by applications
Table 68: Demand for food packaging made of plastics in Finland from 2019 to 2031 – split by applications
Table 69: Demand for food packaging made of plastics in Finland from 2019 to 2031 – split by types of packaging
Table 70: Demand for food packaging made of paper & cardboard in Finland from 2019 to 2031 – split by applications
Table 71: Demand for food packaging made of paper & cardboard in Finland from 2019 to 2031 – split by types of packaging
Table 72: Demand for food packaging made of metal in Finland from 2019 to 2031 – split by applications
Table 73: Demand for food packaging made of metal in Finland from 2019 to 2031 – split by types of packaging
Table 74: Demand for food packaging made of glass in Finland from 2019 to 2031 – split by applications
Table 75: Demand for food packaging in France from 2019 to 2031 – split by applications
Table 76: Demand for food packaging made of plastics in France from 2019 to 2031 – split by applications
Table 77: Demand for food packaging made of plastics in France from 2019 to 2031 – split by types of packaging
Table 78: Demand for food packaging made of plastics in France from 2019 to 2031 – split by types of plastics
Table 79: Demand for food packaging made of paper & cardboard in France from 2019 to 2031 – split by applications
Table 80: Demand for food packaging made of paper & cardboard in France from 2019 to 2031 – split by types of packaging
Table 81: Demand for food packaging made of metal in France from 2019 to 2031 – split by applications
Table 82: Demand for food packaging made of metal in France from 2019 to 2031 – split by types of packaging
Table 83: Demand for food packaging made of glass in France from 2019 to 2031 – split by applications
Table 84: Demand for food packaging in Germany from 2019 to 2031 – split by applications
Table 85: Demand for food packaging made of plastics in Germany from 2019 to 2031 – split by applications
Table 86: Demand for food packaging made of plastics in Germany from 2019 to 2031 – split by types of packaging
Table 87: Demand for food packaging made of plastics in Germany from 2019 to 2031 – split by types of plastics
Table 88: Demand for food packaging made of paper & cardboard in Germany from 2019 to 2031 – split by applications
Table 89: Demand for food packaging made of paper & cardboard in Germany from 2019 to 2031 – split by types of packaging
Table 90: Demand for food packaging made of metal in Germany from 2019 to 2031 – split by applications
Table 91: Demand for food packaging made of metal in Germany from 2019 to 2031 – split by types of packaging
Table 92: Demand for food packaging made of glass in Germany from 2019 to 2031 – split by applications
Table 93: Demand for food packaging in Greece from 2019 to 2031 – split by applications
Table 94: Demand for food packaging made of plastics in Greece from 2019 to 2031 – split by applications
Table 95: Demand for food packaging made of plastics in Greece from 2019 to 2031 – split by types of packaging
Table 96: Demand for food packaging made of paper & cardboard in Greece from 2019 to 2031 – split by applications
Table 97: Demand for food packaging made of paper & cardboard in Greece from 2019 to 2031 – split by types of packaging
Table 98: Demand for food packaging made of metal in Greece from 2019 to 2031 – split by applications
Table 99: Demand for food packaging made of metal in Greece from 2019 to 2031 – split by types of packaging
Table 100: Demand for food packaging made of glass in Greece from 2019 to 2031 – split by applications
Table 101: Demand for food packaging in Hungary from 2019 to 2031 – split by applications
Table 102: Demand for food packaging made of plastics in Hungary from 2019 to 2031 – split by applications
Table 103: Demand for food packaging made of plastics in Hungary from 2019 to 2031 – split by types of packaging
Table 104: Demand for food packaging made of paper & cardboard in Hungary from 2019 to 2031 – split by applications
Table 105: Demand for food packaging made of paper & cardboard in Hungary from 2019 to 2031 – split by types of packaging
Table 106: Demand for food packaging made of metal in Hungary from 2019 to 2031 – split by applications
Table 107: Demand for food packaging made of metal in Hungary from 2019 to 2031 – split by types of packaging
Table 108: Demand for food packaging made of glass in Hungary from 2019 to 2031 – split by applications
Table 109: Demand for food packaging in Italy from 2019 to 2031 – split by applications
Table 110: Demand for food packaging made of plastics in Italy from 2019 to 2031 – split by applications
Table 111: Demand for food packaging made of plastics in Italy from 2019 to 2031 – split by types of packaging
Table 112: Demand for food packaging made of plastics in Italy from 2019 to 2031 – split by types of packaging
Table 113: Demand for food packaging made of paper & cardboard in Italy from 2019 to 2031 – split by applications
Table 114: Demand for food packaging made of paper & cardboard in Italy from 2019 to 2031 – split by types of packaging
Table 115: Demand for food packaging made of metal in Italy from 2019 to 2031 – split by applications
Table 116: Demand for food packaging made of metal in Italy from 2019 to 2031 – split by types of packaging
Table 117: Demand for food packaging made of glass in Italy from 2019 to 2031 – split by applications
Table 118: Demand for food packaging in Lithuania from 2019 to 2031 – split by applications
Table 119: Demand for food packaging made of plastics in Lithuania from 2019 to 2031 – split by applications
Table 120: Demand for food packaging made of plastics in Lithuania from 2019 to 2031 – split by types of packaging
Table 121: Demand for food packaging made of paper & cardboard in Lithuania from 2019 to 2031 – split by applications
Table 122: Demand for food packaging made of paper & cardboard in Lithuania from 2019 to 2031 – split by types of packaging
Table 123: Demand for food packaging made of metal in Lithuania from 2019 to 2031 – split by applications
Table 124: Demand for food packaging made of metal in Lithuania from 2019 to 2031 – split by types of packaging
Table 125: Demand for food packaging made of glass in Lithuania from 2019 to 2031 – split by applications
Table 126: Demand for food packaging in Norway from 2019 to 2031 – split by applications
Table 127: Demand for food packaging made of plastics in Norway from 2019 to 2031 – split by applications
Table 128: Demand for food packaging made of plastics in Norway from 2019 to 2031 – split by types of packaging
Table 129: Demand for food packaging made of paper & cardboard in Norway from 2019 to 2031 – split by applications
Table 130: Demand for food packaging made of paper & cardboard in Norway from 2019 to 2031 – split by types of packaging
Table 131: Demand for food packaging made of metal in Norway from 2019 to 2031 – split by applications
Table 132: Demand for food packaging made of metal in Norway from 2019 to 2031 – split by types of packaging
Table 133: Demand for food packaging made of glass in Norway from 2019 to 2031 – split by applications
Table 134: Demand for food packaging in Poland from 2019 to 2031 – split by applications
Table 135: Demand for food packaging made of plastics in Poland from 2019 to 2031 – split by applications
Table 136: Demand for food packaging made of plastics in Poland from 2019 to 2031 – split by types of packaging
Table 137: Demand for food packaging made of plastics in Poland from 2019 to 2031 – split by types of plastics
Table 138: Demand for food packaging made of paper & cardboard in Poland from 2019 to 2031 – split by applications
Table 139: Demand for food packaging made of paper & cardboard in Poland from 2019 to 2031 – split by types of packaging
Table 140: Demand for food packaging made of metal in Poland from 2019 to 2031 – split by applications
Table 141: Demand for food packaging made of metal in Poland from 2019 to 2031 – split by types of packaging
Table 142: Demand for food packaging made of glass in Poland from 2019 to 2031 – split by applications
Table 143: Demand for food packaging in Portugal from 2019 to 2031 – split by applications
Table 144: Demand for food packaging made of plastics in Portugal from 2019 to 2031 – split by applications
Table 145: Demand for food packaging made of plastics in Portugal from 2019 to 2031 – split by types of packaging
Table 146: Demand for food packaging made of paper & cardboard in Portugal from 2019 to 2031 – split by applications
Table 147: Demand for food packaging made of paper & cardboard in Portugal from 2019 to 2031 – split by types of packaging
Table 148: Demand for food packaging made of metal in Portugal from 2019 to 2031 – split by applications
Table 149: Demand for food packaging made of metal in Portugal from 2019 to 2031 – split by types of packaging
Table 150: Demand for food packaging made of glass in Portugal from 2019 to 2031 – split by applications
Table 151: Demand for food packaging in Romania from 2019 to 2031 – split by applications
Table 152: Demand for food packaging made of plastics in Romania from 2019 to 2031 – split by applications
Table 153: Demand for food packaging made of plastics in Romania from 2019 to 2031 – split by types of packaging
Table 154: Demand for food packaging made of paper & cardboard in Romania from 2019 to 2031 – split by applications
Table 155: Demand for food packaging made of paper & cardboard in Romania from 2019 to 2031 – split by types of packaging
Table 156: Demand for food packaging made of metal in Romania from 2019 to 2031 – split by applications
Table 157: Demand for food packaging made of metal in Romania from 2019 to 2031 – split by types of packaging
Table 158: Demand for food packaging made of glass in Romania from 2019 to 2031 – split by applications
Table 159: Demand for food packaging in Russia from 2019 to 2031 – split by applications
Table 160: Demand for food packaging made of plastics in Russia from 2019 to 2031 – split by applications
Table 161: Demand for food packaging made of plastics in Russia from 2019 to 2031 – split by types of packaging
Table 162: Demand for food packaging made of plastics in Russia from 2019 to 2031 – split by types of plastics
Table 163: Demand for food packaging made of paper & cardboard in Russia from 2019 to 2031 – split by applications
Table 164: Demand for food packaging made of paper & cardboard in Russia from 2019 to 2031 – split by types of packaging
Table 165: Demand for food packaging made of metal in Russia from 2019 to 2031 – split by applications
Table 166: Demand for food packaging made of metal in Russia from 2019 to 2031 – split by types of packaging
Table 167: Demand for food packaging made of glass in Russia from 2019 to 2031 – split by applications
Table 168: Demand for food packaging in Sweden from 2019 to 2031 – split by applications
Table 169: Demand for food packaging made of plastics in Sweden from 2019 to 2031 – split by applications
Table 170: Demand for food packaging made of plastics in Sweden from 2019 to 2031 – split by types of packaging
Table 171: Demand for food packaging made of paper & cardboard in Sweden from 2019 to 2031 – split by applications
Table 172: Demand for food packaging made of paper & cardboard in Sweden from 2019 to 2031 – split by types of packaging
Table 173: Demand for food packaging made of metal in Sweden from 2019 to 2031 – split by applications
Table 174: Demand for food packaging made of metal in Sweden from 2019 to 2031 – split by types of packaging
Table 175: Demand for food packaging made of glass in Sweden from 2019 to 2031 – split by applications
Table 176: Demand for food packaging in Slovakia from 2019 to 2031 – split by applications
Table 177: Demand for food packaging made of plastics in Slovakia from 2019 to 2031 – split by applications
Table 178: Demand for food packaging made of plastics in Slovakia from 2019 to 2031 – split by types of packaging
Table 179: Demand for food packaging made of paper & cardboard in Slovakia from 2019 to 2031 – split by applications
Table 180: Demand for food packaging made of paper & cardboard in Slovakia from 2019 to 2031 – split by types of packaging
Table 181: Demand for food packaging made of metal in Slovakia from 2019 to 2031 – split by applications
Table 182: Demand for food packaging made of metal in Slovakia from 2019 to 2031 – split by types of packaging
Table 183: Demand for food packaging made of glass in Slovakia from 2019 to 2031 – split by applications
Table 184: Demand for food packaging in Spain from 2019 to 2031 – split by applications
Table 185: Demand for food packaging made of plastics in Spain from 2019 to 2031 – split by applications
Table 186: Demand for food packaging made of plastics in Spain from 2019 to 2031 – split by types of packaging
Table 187: Demand for food packaging made of plastics in Spain from 2019 to 2031 – split by types of plastics
Table 188: Demand for food packaging made of paper & cardboard in Spain from 2019 to 2031 – split by applications
Table 189:Demand for food packaging made of paper & cardboard in Spain from 2019 to 2031 – split by types of packaging
Table 190: Demand for food packaging made of metal in Spain from 2019 to 2031 – split by applications
Table 191: Demand for food packaging made of metal in Spain from 2019 to 2031 – split by types of packaging
Table 192: Demand for food packaging made of glass in Spain from 2019 to 2031 – split by applications
Table 193: Demand for food packaging in the Netherlands from 2019 to 2031 – split by applications
Table 194: Demand for food packaging made of plastics in the Netherlands from 2019 to 2031 – split by applications
Table 195: Demand for food packaging made of plastics in the Netherlands from 2019 to 2031 – split by types of packaging
Table 196: Demand for food packaging made of paper & cardboard in the Netherlands from 2019 to 2031 – split by applications
Table 197: Demand for food packaging made of paper & cardboard in the Netherlands from 2019 to 2031 – split by types of packaging
Table 198: Demand for food packaging made of metal in the Netherlands from 2019 to 2031 – split by applications
Table 199: Demand for food packaging made of metal in the Netherlands from 2019 to 2031 – split by types of packaging
Table 200: Demand for food packaging made of glass in the Netherlands from 2019 to 2031 – split by applications
Table 201: Demand for food packaging in Turkey from 2019 to 2031 – split by applications
Table 202: Demand for food packaging made of plastics in Turkey from 2019 to 2031 – split by applications
Table 203: Demand for food packaging made of plastics in Turkey from 2019 to 2031 – split by types of packaging
Table 204: Demand for food packaging made of plastics in Turkey from 2019 to 2031 – split by types of plastics
Table 205: Demand for food packaging made of paper & cardboard in Turkey from 2019 to 2031 – split by applications
Table 206: Demand for food packaging made of paper & cardboard in Turkey from 2019 to 2031 – split by types of packaging
Table 207: Demand for food packaging made of metal in Turkey from 2019 to 2031 – split by applications
Table 208: Demand for food packaging made of metal in Turkey from 2019 to 2031 – split by types of packaging
Table 209: Demand for food packaging made of glass in Turkey from 2019 to 2031 – split by applications
Table 210: Demand for food packaging in the United Kingdom from 2019 to 2031 – split by applications
Table 211: Demand for food packaging made of plastics in the United Kingdom from 2019 to 2031 – split by applications
Table 212: Demand for food packaging made of plastics in the United Kingdom from 2019 to 2031 – split by types of packaging
Table 213: Demand for food packaging made of plastics in the United Kingdom from 2019 to 2031 – split by types of plastics
Table 214: Demand for food packaging made of paper & cardboard in the United Kingdom from 2019 to 2031 – split by applications
Table 215: Demand for food packaging in the United Kingdom from 2019 to 2031 – split by types of packaging
Table 216: Demand for food packaging made of metal in the United Kingdom from 2019 to 2031 – split by applications
Table 217: Demand for food packaging made of metal in the United Kingdom from 2019 to 2031 – split by types of packaging
Table 218: Demand for food packaging made of glass in the United Kingdom from 2019 to 2031 – split by applications
Table 219: Demand for food packaging in the remaining European countries from 2019 to 2031 – split by applications
Table 220: Demand for food packaging made of plastics in the remaining European countries from 2019 to 2031 – split by applications
Table 221: Demand for food packaging made of plastics in the remaining European countries from 2019 to 2031 – split by applications
Table 222: Demand for food packaging made of paper & cardboard in the remaining European countries from 2019 to 2031 – split by applications
Table 223: Demand for food packaging made of paper & cardboard in the remaining European countries from 2019 to 2031 – split by types of packaging
Table 224: Demand for food packaging made of metal in the remaining European countries from 2019 to 2031 – split by applications
Table 225: Demand for food packaging made of metal in the remaining European countries from 2019 to 2031 – split by types of packaging
Table 226: Demand for food packaging made of glass in the remaining European countries from 2019 to 2031 – split by applications


