

Description
Are you interested in an updated edition? Then please indicate the desired publication date and content in the form. We look forward to responding to you promptly.
The Flexible Packaging Market Report – Europe is now also available in parts (e.g. individual country profiles or all manufacturer profiles). Please feel free to contact us and we will immediately send you an offer for your specific selection.
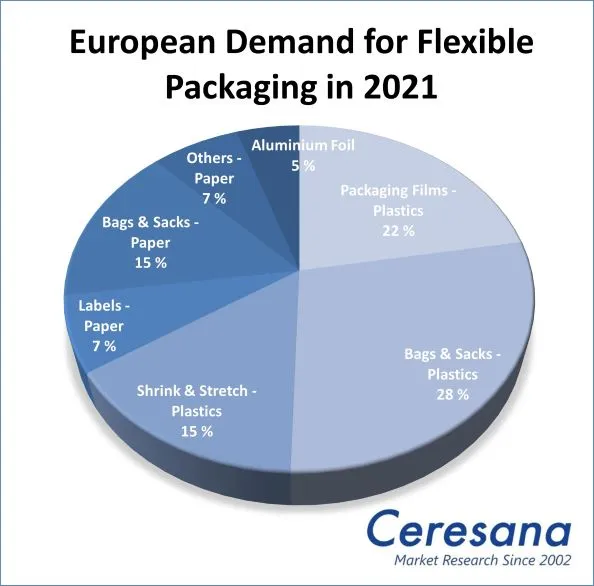
Is the unpackaged trend over again? Recently, numerous small stores that were committed to organic and fair-trade products have had to give up. On the other hand, large supermarket chains are trying to reduce the amount of plastic waste with reusable nets and paper bags. This is the second time Ceresana has studied the European market for flexible packaging made of plastics, paper and aluminum. This includes consumer goods packaging for end users, but also, for example, shrink and stretch films for storage and transport, labels, carrier bags of all kinds, bags for heavy loads and flexible intermediate bulk containers (FIBC). Ceresana expects overall demand for flexible packaging in Europe to decline somewhat, reaching about 19.05 million tonnes in 2031. However, the various packaging types and materials are developing at different rates.
Sturdy Bags
In many sectors of the economy, the Corona pandemic led to a sharp drop. Conversely, food retail sales grew slightly during the lockdown months: in many places, restaurants were closed and consumers had more time to cook for themselves. This also increased demand for pouches for food. However, this effect is now fading again: at the end of 2022 and probably also in 2023, many households will have to save because of rising energy costs and inflation. Demand for shrink and stretch films, heavy-duty and industrial bags correlate closely with the development of the economy as a whole: the level of 2019 is not expected to be reached again in these market segments until 2025. Transport packaging benefits from the still growing volume of internet trade. The ongoing convenience trend is driving demand for stand-up pouches, where composite films enable weight reduction compared to rigid packaging. For pharmaceutical products, the trend in the packaging market continues to be towards pre-portioned individual packaging for medicines, for example disposable sachets.
Less Plastic, More Paper
The European Union’s “Green Deal” and “Plastics Strategy” are starting to take effect: thin plastic carrier bags and shirt bags are being banned or subjected to fees in more and more EU countries. Their demand is declining. They are often replaced by paper bags and pouches, but these are not necessarily sustainable either. At the same time, the demand for trash bags is increasing because fewer and fewer carrier bags are finding a secondary use as trash bags. Market researchers at Ceresana expect this trend to continue until around 2026, when demand for trash bags is expected to fall slightly again. By contrast, paper is often being replaced by plastic alternatives in the case of labels. Overall, Ceresana expects growth in demand for packaging films to resume from 2024 onwards, although this will be hampered by environmental policy measures to combat plastic waste as well as by higher manufacturing costs.
Overview of the Study:
In Chapter 1, the demand for flexible packaging is given in tonnes for Europe as a whole, broken down into:
- packaging films
- bags and sacks
- shrink and stretch films
- labels
- other packaging.
While the focus is primarily on plastics, the materials aluminum and paper are also taken into account.
Chapter 2 provides an in-depth examination of the various types of flexible packaging made of plastic and paper: data on the development of demand for packaging films, bags and sacks, shrink and stretch films, labels and other packaging, each broken down for 19 national markets in Europe.
Demand in the various countries is broken down by packaging materials:
- polyethylene
- polypropylene
- polyethylene terephthalate (PET)
- polyvinyl chloride (PVC)
- other plastics
- paper
- aluminum.
In addition, the market analysis sheds light on the application areas of flexible packaging: The areas “food and beverages,” “consumer non-food,” “heavy-duty and transport,” and “carrier bags” are examined for the eight largest markets (Germany, France, the United Kingdom, Italy, Poland, Russia, Spain, and Turkey) as well as for the aggregate of other European countries.
Chapter 3 provides company profiles of the most important manufacturers of flexible packaging, clearly arranged according to contact details, revenues, profit, product range, production sites, brief profile as well as product types and application areas. Detailed profiles are provided by 72 manufacturers, such as Leipa Georg Leinfelder GmbH, Papier-Mettler KG, Polifilm GmbH, RKW SE, Sappi Europe, Südpack Verpackungen GmbH & Co. KG, Taghleef Industries LLC, and Treofan Group.
Scope of the Report:
Attributes | Details |
| Base Year | 2021 |
| Trend Period | 2019 – 2031 |
| Forecast Period | 2022 – 2031 |
| Pages | 250 |
| Material | Polyethylene, Polypropylene, Polyethylene Terephthalate (PET), Polyvinyl Chloride (PVC), Other Plastics, Paper, Aluminum |
| Application Area | Packaging Films, Bags and Sacks, Shrink and Stretch Films, Labels, Other Packaging |
| Company Profiles | Leipa Georg Leinfelder GmbH, Papier-Mettler KG, Polifilm GmbH, RKW SE, Sappi Europe, Südpack Verpackungen GmbH & Co. KG, Taghleef Industries LLC, and Treofan Group (Selection) |
| Edition | 2nd edition |
| Publication | November 2022 |
FAQs
How high is the European consumption of flexible packaging expected to be by 2031?
We expect total demand for flexible packaging in Europe to reach a volume of around 19.05 million tonnes by 2031.
Which factors are affecting the market for flexible packaging?
In many sectors, the Corona pandemic affected the market for flexible packaging. Further, the European Union’s “Green Deal” and “Plastics Strategy” are starting to take effect.
1 Market Data: Europe
1.1 Demand
1.2 Demand Split by Types of Packaging
1.2.1 Packaging Films – Plastics
1.2.2 Bags and Sacks – Plastics
1.2.3 Shrink & Stretch Films – Plastics
1.2.4 Labels – Paper
1.2.5 Bags and Sacks – Paper
1.2.6 Other Packaging – Paper
1.2.7 Films – Aluminum
1.3 Demand Split by Materials
1.3.1 Polyethylene
1.3.2 Polypropylene
1.3.3 PET
1.3.4 PVC
1.3.5 Other Plastics
1.3.6 Plastics – Total
1.3.7 Paper – Total
1.3.8 Aluminum – Total
1.4 Demand Split By Application Areas
1.4.1 Food incl. Beverages
1.4.2 Consumer Non-Food
1.4.3 Heavy Duty and Transport
1.4.4 Carrier Bags
2 Market Data: Countries
2.1 Austria
2.1.1 Demand – Types of Packaging
2.1.2 Demand – Materials
2.2 Belgium
2.2.1 Demand – Types of Packaging
2.2.2 Demand – Materials
2.3 Czechia
2.3.1 Demand – Types of Packaging
2.3.2 Demand – Materials
2.4 Finland
2.4.1 Demand – Types of Packaging
2.4.2 Demand – Materials
2.5 France
2.5.1 Demand – Types of Packaging
2.5.2 Demand – Materials
2.5.3 Demand – Application Areas
2.6 Germany
2.6.1 Demand – Types of Packaging
2.6.2 Demand – Materials
2.6.3 Demand – Application Areas
2.7 Greece
2.7. 1 Demand – Types of Packaging
2.7.2 Demand – Materials
2.8 Hungary
2.8.1 Demand – Types of Packaging
2.8.2 Demand – Materials
2.9 Italy
2.9.1 Demand – Types of Packaging
2.9.2 Demand – Materials
2.9.3 Demand – Application Areas
2.10 Norway
2.10.1 Demand – Types of Packaging
2.10.2 Demand – Materials
2.11 Poland
2.11.1 Demand – Types of Packaging
2.11.2 Demand – Materials
2.11.3 Demand – Application Areas
2.12 Portugal
2.12.1 Demand – Types of Packaging
2.12.2 Demand – Materials
2.13 Romania
2.13.1 Demand – Types of Packaging
2.13.2 Demand – Materials
2.14 Russia
2.14.1 Demand – Types of Packaging
2.14.2 Demand – Materials
2.14.3 Demand – Application Areas
2.15 Spain
2.15.1 Demand – Types of Packaging
2.15.2 Demand – Materials
2.15.3 Demand – Application Areas
2.16 Sweden
2.16.1 Demand – Types of Packaging
2.16.2 Demand – Materials
2.17 The Netherlands
2.17.1 Demand – Types of Packaging
2.17.2 Demand – Materials
2.18 Turkey
2.18.1 Demand – Types of Packaging
2.18.2 Demand – Materials
2.18.3 Demand – Application Areas
2.20 United Kingdom
2.20.1 Demand – Types of Packaging
2.20.2 Demand – Materials
2.20.3 Demand – Application Areas
2.21 Rest of Europe
2.21.1 Demand – Types of Packaging
2.21.2 Demand – Materials
3 Company Profiles*
Austria (6 Producers)
Belgium (2)
Czechia (2)
Finland (5)
France (1)
Germany (17)
Greece (1)
Hungary (1)
Italy (11)
Lithuania (1)
Luxembourg (2)
Poland (2)
Spain (3)
Sweden (2)
Switzerland (7)
The Netherlands (1)
Turkey (2)
United Kingdom (6)
*Note: The profiles are assigned to the country in which the company or holding is headquartered. Profiles also include JVs and subsidiaries.
Graph 1: Demand in Europe from 2019 to 2031
Graph 2: Demand in Austria from 2019 until 2031
Graph 3: Demand in Belgium from 2019 to 2031
Graph 4: Demand in Czechia from 2019 to 2031
Graph 5: Demand in Finland from 2019 to 2031
Graph 6: Demand in France from 2019 to 2031
Graph 7: Demand in Germany from 2019 to 2031
Graph 8: Demand in Greece from 2019 to 2031
Graph 9: Demand in Hungary from 2019 to 2031
Graph 10: Demand in Italy from 2019 to 2031
Graph 11: Demand in Norway from 2019 to 2031
Graph 12: Demand in Poland from 2019 to 2031
Graph 13: Demand in Portugal from 2019 to 2031
Graph 14: Demand in Romania from 2019 to 2031
Graph 15: Demand in Russia from 2019 to 2031
Graph 16: Demand in Spain from 2019 to 2031
Graph 17: Demand in Sweden from 2019 to 2031
Graph 18: Demand in the Netherlands from 2019 to 2031
Graph 19: Demand in Turkey from 2019 to 2031
Graph 20: Demand in the United Kingdom from 2019 to 2031
Graph 21: Demand in the remaining European countries from 2019 to 2031
Table 1: European demand from 2019 to 2031 – split by countries
Table 2: European demand from 2019 to 2031 – split by types of packaging
Table 3: European demand for packaging films from 2019 to 2031 – split by countries
Table 4: European demand for bags & sacks made of plastics from 2019 to 2031 – split by countries
Table 5: European demand for shrink & stretch films from 2019 to 2031 – split by countries
Table 6: European demand for labels made of paper from 2019 to 2031 – split by countries
Table 7: Eurpean demand for bags & sacks made of paper from 2019 to 2031 – split by countries
Table 8: European demand for other packaging made of paper from 2019 to 2031 – split by countries
Table 9: European demand for films made of aluminum from 2019 to 2031 – split by countries
Table 10: European demand from 2019 to 2031 – split by materials
Table 11: European demand for flexible packaging made of polyethylene from 2019 to 2031 – split by countries
Table 12: European demand for flexible packaging made of polypropylene from 2019 to 2031 – split by countries
Table 13: European demand for flexible packaging made of PET from 2019 to 2031 – split by countries
Table 14: European demand for flexible packaging made of PVC from 2019 to 2031 – split by countries
Table 15: European demand for flexible packaging made of other plastics from 2019 to 2031 – split by countries
Table 16: European demand for flexible packaging made of plastics from 2019 to 2031 – split by countries
Table 17: European demand for flexible packaging made of paper from 2019 to 2031 – split by countries
Table 18: European demand for flexible packaging made of aluminum from 2019 to 2031 – split by countries
Table 19: European demand from 2019 to 2031 – split by applications
Table 20: European demand in the segment Food incl. Beverages from 2019 to 2031 – split by countries
Table 21: European demand in the segment Consumer Non-Food from 2019 to 2031 – split by countries
Table 22: European demand in the segment Heavy Duty and Transport from 2019 to 2031 – split by countries
Table 23: European demand in the segment Carrier Bags from 2019 to 2031 – split by countries
Table 24: Demand in Austria from 2019 to 2031 – split by types of packaging
Table 25: Demand in Austria from 2019 to 2031 – split by materials
Table 26: Demand in Belgium from 2019 to 2031 – split by types of packaging
Table 27: Demand in Belgium from 2019 to 2031 – split by materials
Table 28: Demand in Czechia from 2019 to 2031 – split by types of packaging
Table 29: Demand in Czechia from 2019 to 2031 – split by materials
Table 30: Demand in Finland from 2019 to 2031 – split by types of packaging
Table 31: Demand in Finland from 2019 to 2031 – split by materials
Table 32: Demand in France from 2019 to 2031 – split by types of packaging
Table 33: Demand in France from 2019 to 2031 – split by materials
Table 34: Demand in France from 2019 to 2031 – split by applications
Table 35: Demand in Germany from 2019 to 2031 – split by types of packaging
Table 36: Demand in Germany from 2019 to 2031 – split by materials
Table 37: Demand in Germany from 2019 to 2031 – split by applications
Table 38: Demand in Greece from 2019 to 2031 – split by types of packaging
Table 39: Demand in Greece from 2019 to 2031 – split by materials
Table 40: Demand in Hungary from 2019 to 2031 – split by types of packaging
Table 41: Demand in Hungary from 2019 to 2031 – split by materials
Table 42: Demand in Italy from 2019 to 2031 – split by types of packaging
Table 43: Demand in Italy from 2019 to 2031 – split by materials
Table 44: Demand in Italy from 2019 to 2031 – split by applications
Table 45: Demand in Norway from 2019 to 2031 – split by types of packaging
Table 46: Demand in Norway from 2019 to 2031 – split by types of materials
Table 47: Demand in Poland from 2019 to 2031 – split by types of packaging
Table 48: Demand in Poland from 2019 to 2031 – split by materials
Table 49: Demand in Poland from 2019 to 2031 – split by applications
Table 50: Demand in Portugal from 2019 to 2031 – split by types of packaging
Table 51: Demand in Portugal from 2019 to 2031 – split by materials
Table 52: Demand in Romania from 2019 to 2031 – split by types of packaging
Table 53: Demand in Romania from 2019 to 2031 – split by materials
Table 54: Demand in Russia from 2019 to 2031 – split by types of packaging
Table 55: Demand in Russia from 2019 to 2031 – split by materials
Table 56: Demand in Russia from 2019 to 2031 – split by applications
Table 57: Demand in Spain from 2019 to 2031 – split by types of packaging
Table 58: Demand in Spain from 2019 to 2031 – split by materials
Table 59:Demand in Spain from 2019 to 2031 – split by applications
Table 60: Demand in Sweden from 2019 to 2031 – split by types of packaging
Table 61: Demand in Sweden from 2019 to 2031 – split by materials
Table 62: Demand in the Netherlands from 2019 to 2031 – split by types of packaging
Table 63: Demand in the Netherlands from 2019 to 2031 – split by materials
Table 64: Demand in Turkey from 2019 to 2031 – split by types of packaging
Table 65: Demand in Turkey from 2019 to 2031 – split by materials
Table 66: Demand in Turkey from 2019 to 2031 – split by applications
Table 67: Demand in the United Kingdom from 2019 to 2031 – split by types of packaging
Table 68: Demand in the United Kingdom from 2019 to 2031 – split by materials
Table 69: Demand in the United Kingdom from 2019 to 2031 – split by applications
Table 70: Demand in the remaining European countries from 2019 to 2031 – split by types of packaging
Table 71: Demand in the remaining European countries from 2019 to 2031 – split by materials


