

Description
The Plastic Caps and Closures Market Report – Europe is now also available in parts (e.g. individual country profiles or all manufacturer profiles). Please feel free to contact us and we will immediately send you an offer for your specific selection.
Changing lifestyles and new consumer generations revolutionize the packaging market. The uninterrupted trend towards on-the-go products, for example, is boosting the demand for resealable packaging, especially in the food sector. Ceresana’s latest, third market report on the European market for plastic caps and closures offers comprehensive information on these different application areas: from beverages, food items, cosmetics, pharmaceuticals (OTC) to household chemicals and other applications. Various subcategories and closure types are examined in detail. With regard to the number of sold quantities, Ceresana expects an increase in European sales of plastic caps and closures of around 2.4 % per year until 2026.
Closures for Flexible Packaging
Plastic caps and closures are becoming increasingly popular on the market for flexible packaging. Stand-up pouches are light, handy, save raw materials, and offer versatile design and print options. In the beginning, they were lacking practical spout openings and could not be resealed. By now, there is a wide array of suitable stand-up pouches with integrated and resealable spouts for liquids, viscous materials, creams, and other applications. Due to the small size of these closures alone, manufacturers have to meet different requirements than those for traditional screw caps.
Unquenched Thirst for Mineral Water
Each application area requires specific closure properties. This also has an effect on the design, raw material, and choice of cap. In addition to the change in packaging types such as the trend towards stand-up pouches, other factors also influence the demand for plastic caps and closures. Consumer health concerns and state taxes on sugary beverages inhibit the demand for carbonated soft drinks or fruit juices in many countries. By contrast, demand for packaged water will likely continue to show high growth rates in the coming years. In the food sector, ready meals and other convenience foods in particular constitute expanding markets. However, the individual parameters and the resulting market dynamics can vary considerably from region to region.
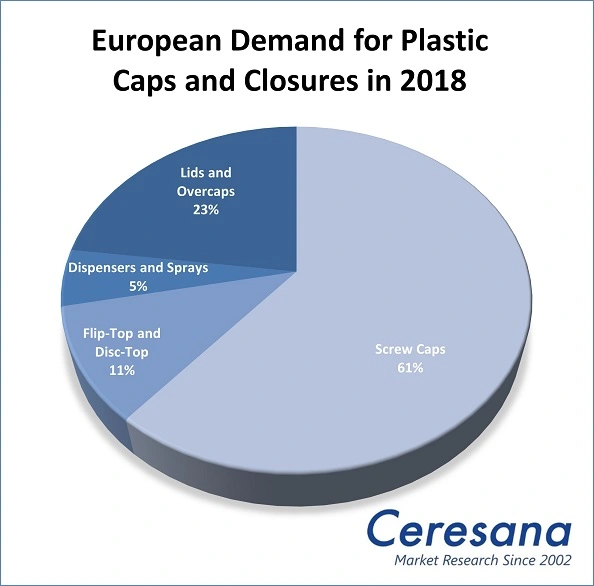
Strong Growth for Lids and Overcaps in the Food Sector
This market report on plastic caps and closures examines the demand for the following types of plastic closures in 22 countries (e.g. Russia, Switzerland, and Turkey): “screw caps”, “flip-top and disc-top closures”, “dispensers and sprays” as well as “lids and overcaps”. Plastic lids and over-caps are recording high growth rates, especially in the food sector. A wide range of ready meals, which are often made for consumption on the go, are equipped with these types of closures. The trend towards convenience products currently leads to a significant increase in demand – with no end in sight for this development.
The Study in Brief:
Chapter 1 offers an overview of the European Market for plastic caps and closures, including forecasts until 2026. Data on production and demand volumes as well as on the individual closure types and application areas is listed in clear tables and figures. The data is presented in billion units.
Chapter 2 offers a detailed analysis of 22 countries (e.g. Russia, Switzerland, and Turkey) with regard to production, demand, as well as import and export. In addition, demand is split by these application areas and closure types:
Application Areas:
- Lemonades (CSD)
- Water
- Fruit Juices
- Other non-alcoholic Beverages
- Alcoholic Beverages
- Sauces and Condiments
- Ready Meals and Convenience Food
- Dairy Products
- Spreads and Other Food
- Cosmetics and Personal Care
- Pharmaceuticals (OTC)
- Household Chemicals and Other Applications
Closure types:
- Screw Caps
- Flip-Top and Disc-Top Closures
- Dispensers and Sprays
- Lids and Overcaps
Chapter 3 presents useful company profiles of the largest manufacturers of plastic caps and closures – neatly arranged according to contact details, revenues, profit, product range, production sites, profile summary, and application areas. In-depth profiles of 77 producers are listed, such as Gerresheimer AG, Alpla-Werke Alwin Lehner GmbH & Co. KG, Ball Corporation, Colep Portugal, S.A., Coveris Holdings S.A., Greiner Packaging International GmbH, Groupe Guillin Holding, Huhtamaki Oyj, Mauser Holding GmbH, Nolato AB, Plastek UK Ltd., RPC Group Plc., and Tetra Laval Group.
Scope of the Report:
Attributes | Details |
| Base Year | 2018 |
| Trend Period | 2010 – 2026 |
| Forecast Period | 2019 – 2026 |
| Pages | 280 |
| Application Areas | Lemonades (CSD), Water, Fruit Juices, Other Non-Alcoholic Beverages, Alcoholic Beverages, Sauces and Condiments, Ready Meals and Convenience Food, Dairy Products, Spreads and Other Food, Cosmetics and Personal Care, Pharmaceuticals (OTC), Household Chemicals and Other Applications |
| Closure Types | Screw Caps, Flip-Top and Disc-Top Closures, Dispensers and Sprays, Lids and Overcaps |
| Company Profiles | Gerresheimer AG, Alpla-Werke Alwin Lehner GmbH & Co. KG, Ball Corporation, Colep Portugal, S.A., Coveris Holdings S.A., Greiner Packaging International GmbH, Groupe Guillin Holding, Huhtamaki Oyj, Mauser Holding GmbH, Nolato AB, Plastek UK Ltd., RPC Group Plc., and Tetra Laval Group (Selection) |
| Edition | 3rd edition |
| Publication | December 2019 |
FAQs
How will sales of plastic closures develop up to the year 2026?
With regard to the number of sold quantities, Ceresana expects an increase in European sales of plastic caps and closures of around 2.4 % per year until 2026.
Which application area is showing high growth rates?
In the food sector, ready meals and other convenience foods in particular constitute expanding markets.
What factors are restraining the growth of certain application areas?
Consumer health concerns and state taxes on sugary beverages inhibit the demand for carbonated soft drinks or fruit juices in many countries.
1 Market Data
1.1 Europe
1.1.1 Demand
1.1.2 Production
1.1.3 Applications
1.1.3.1 Lemonades (CSD)
1.1.3.2 Water
1.1.3.3 Fruit Juices
1.1.3.4 Other Non-Alcoholic Beverages
1.1.3.5 Alcoholic Beverages
1.1.3.6 Sauces and Condiments
1.1.3.7 Ready Meals and Convenience Food
1.1.3.8 Dairy Products
1.1.3.9 Spreads and Other Food
1.1.3.10 Cosmetics and Personal Care
1.1.3.11 Pharmaceuticals (OTC)
1.1.3.12 Household Chemicals and Other Applications
1.1.4 Closure types
1.1.4.1 Screw Caps
1.1.4.2 Flip-Top and Disc-Top Closures
1.1.4.3 Dispensers and Sprays
1.1.4.4 Lids and Overcaps
2 Market Data: Countries
2.1 Europe
2.1.1 Austria
2.1.1.1 Demand
2.1.1.2 Production and Trade
2.1.2 Belgium
2.1.2.1 Demand
2.1.2.2 Production and Trade
2.1.3 Bulgaria
2.1.3.1 Demand
2.1.3.2 Production and Trade
2.1.4 Czechia
2.1.4.1 Demand
2.1.4.2 Production and Trade
2.1.5 Finland
2.1.5.1 Demand
2.1.5.2 Production and Trade
2.1.6 France
2.1.6.1 Demand
2.1.6.2 Production and Trade
2.1.7 Germany
2.1.7.1 Demand
2.1.7.2 Production and Trade
2.1.8 Greece
2.1.8.1 Demand
2.1.8.2 Production and Trade
2.1.9 Hungary
2.1.9.1 Demand
2.1.9.2 Production and Trade
2.1.10 Italy
2.1.10.1 Demand
2.1.10.2 Production and Trade
2.1.11 Lithuania
2.1.11.1 Demand
2.1.11.2 Production and Trade
2.1.12 Poland
2.1.12.1 Demand
2.1.12.2 Production and Trade
2.1.13 Portugal
2.1.13.1 Demand
2.1.13.2 Production and Trade
2.1.14 Romania
2.1.14.1 Demand
2.1.14.2 Production and Trade
2.1.15 Russia
2.1.15.1 Demand
2.1.15.2 Production and Trade
2.1.16 Slovakia
2.1.16.1 Demand
2.1.16.2 Production and Trade
2.1.17 Spain
2.1.17.1 Demand
2.1.17.2 Production and Trade
2.1.18 Sweden
2.1.18.1 Demand
2.1.18.2 Production and Trade
2.1.19 Switzerland
2.1.19.1 Demand
2.1.19.2 Production and Trade
2.1.20 The Netherlands
2.1.20.1 Demand
2.1.20.2 Production and Trade
2.1.21 Turkey
2.1.21.1 Demand
2.1.21.2 Production and Trade
2.1.22 United Kingdom
2.1.22.1 Demand
2.1.22.2 Production and Trade
2.1.23 Rest of Europe
2.1.23.1 Demand
2.1.23.2 Production and Trade
3 Company Profiles*
Austria (2 Producers)
Belgium (3)
Bulgaria (1)
Czechia (1)
Denmark (1)
Finland (2)
France (5)
Germany (20)
Italy (15)
Luxembourg (1)
Norway (1)
Portugal (2)
Russia (1)
Slovenia (1)
Spain (3)
Sweden (2)
Switzerland (7)
The Netherlands (4)
Turkey (1)
United Kingdom (4)
*Note: The profiles are assigned to the country in which the company or holding is headquartered. Profiles also include JVs and subsidiaries.
Graph 1: European demand for plastic caps and closures from 2010 to 2026
Graph 2: European production of plastic caps and closures from 2010 to 2026
Graph 3: European demand for plastic caps and closures from 2010 to 2026 – split by closure types
Graph 4: Demand for plastic caps and closures in Austria from 2010 to 2026
Graph 5: Production of plastic caps and closures in Austria from 2010 to 2026
Graph 6: Demand for plastic caps and closures in Belgium from 2010 to 2026
Graph 7: Production of plastic caps and closures in Belgium from 2010 to 2026
Graph 8: Demand for plastic caps and closures in Bulgaria from 2010 to 2026
Graph 9: Production of plastic caps and closures in Bulgaria from 2010 to 2026
Graph 10: Demand for plastic caps and closures in Czechia from 2010 to 2026
Graph 11: Production of plastic caps and closures in Czechia from 2010 to 2026
Graph 12: Demand for plastic caps and closures in Finland from 2010 to 2026
Graph 13: Production of plastic caps and closures in Finland from 2010 to 2026
Graph 14: Demand for plastic caps and closures in France from 2010 to 2026
Graph 15: Production of plastic caps and closures in France from 2010 to 2026
Graph 16: Demand for plastic caps and closures in Germany from 2010 to 2026
Graph 17: Production of plastic caps and closures in Germany from 2010 to 2026
Graph 18: Demand for plastic caps and closures in Greece from 2010 to 2026
Graph 19: Production of plastic caps and closures in Greece from 2010 to 2026
Graph 20: Demand for plastic caps and closures in Hungary from 2010 to 2026
Graph 21: Production of plastic caps and closures in Hungary from 2010 to 2026
Graph 22: Demand for plastic caps and closures in Italy from 2010 to 2026
Graph 23: Production of plastic caps and closures in Italy from 2010 to 2026
Graph 24: Demand for plastic caps and closures in Lithuania from 2010 to 2026
Graph 25: Production of plastic caps and closures in Lithuania from 2010 to 2026
Graph 26: Demand for plastic caps and closures in Poland from 2010 to 2026
Graph 27: Production of plastic caps and closures in Poland from 2010 to 2026
Graph 28: Demand for plastic caps and closures in Portugal from 2010 to 2026
Graph 29: Production of plastic caps and closures in Portugal from 2010 to 2026
Graph 30: Demand for plastic caps and closures in Romania from 2010 to 2026
Graph 31: Production of plastic caps and closures in Romania from 2010 to 2026
Graph 32: Demand for plastic caps and closures in Russia from 2010 to 2026
Graph 33: Production of plastic caps and closures in Russia from 2010 to 2026
Graph 34: Demand for plastic caps and closures in Slovakia from 2010 to 2026
Graph 35: Production of plastic caps and closures in Slovakia from 2010 to 2026
Graph 36: Demand for plastic caps and closures in Spain from 2010 to 2026
Graph 37: Production of plastic caps and closures in Spain from 2010 to 2026
Graph 38: Demand for plastic caps and closures in Sweden from 2010 to 2026
Graph 39: Production of plastic caps and closures in Sweden from 2010 to 2026
Graph 40: Demand for plastic caps and closures in Switzerland from 2010 to 2026
Graph 41: Production of plastic caps and closures in Switzerland from 2010 to 2026
Graph 42: Demand for plastic caps and closures in the Netherlands from 2010 to 2026
Graph 43: Production of plastic caps and closures in the Netherlands from 2010 to 2026
Graph 44: Demand for plastic caps and closures in Turkey from 2010 to 2026
Graph 45: Production of plastic caps and closures in Turkey from 2010 to 2026
Graph 46: Demand for plastic caps and closures in the United Kingdom from 2010 to 2026
Graph 47: Production of plastic caps and closures in the United Kingdom from 2010 to 2026
Graph 48: Demand for plastic caps and closures in the remaining European countries from 2010 to 2026
Graph 49: Production of plastic caps and closures in the remaining European countries from 2010 to 2026
Table 1: European demand for plastic caps and closures from 2010 to 2026 – split by countries
Table 2: Production of plastic caps and closures in Europe from 2010 to 2026 – split by countries
Table 3: European demand for plastic caps and closures from 2010 to 2026 – split by applications
Table 4: European demand for plastic caps and closures in the segment lemonades from 2010 to 2026 – split by countries
Table 5: European demand for plastic caps and closures in the segment water from 2010 to 2026 – split by countries
Table 6: European demand for plastic caps and closures in the segment fruit juices from 2010 to 2026 – split by countries
Table 7: European demand for plastic caps and closures in the segment other non-alcoholic beverages from 2010 to 2026 – split by countries
Table 8: European demand for plastic caps and closures in the segment other non-alcoholic beverages from 2010 to 2026 – split by countries
Table 9: European demand for plastic caps and closures in the segment sauces and condiments from 2010 to 2026 – split by countries
Table 10: European demand for plastic caps and closures in the segment ready meals and convenience food from 2010 to 2026 – split by countries
Table 11: European demand for plastic caps and closures in the segment dairy products from 2010 to 2026 – split by countries
Table 12: European demand for plastic caps and closures in the segment spreads and other food from 2010 to 2026 – split by countries
Table 13: European demand for plastic caps and closures in the segment cosmetics and personal care from 2010 to 2026 – split by countries
Table 14: European demand for plastic caps and closures in the segment pharmaceuticals (OTC) from 2010 to 2026 – split by countries
Table 15: European demand for plastic caps and closures in the segment household chemicals and other applications from 2010 to 2026 – split by countries
Table 16: European demand for plastic caps and closures from 2010 to 2026 – split by closure types
Table 17: European demand for screw caps from 2010 to 2026 – split by countries
Table 18: European demand for flip-top and disc-top closures from 2010 to 2026 – split by countries
Table 19: European demand for dispensers and spray closures from 2010 to 2026 – split by countries
Table 20: European demand for lids and overcaps from 2010 to 2026 – split by countries
Table 21: Demand for plastic caps and closures in Austria from 2010 to 2026 – split by applications
Table 22: Demand for plastic caps and closures in Austria from 2010 to 2026 – split by closure types
Table 23: Production, import, and export of and demand for plastic caps and closures in Austria from 2010 to 2026
Table 24: Demand for plastic caps and closures in Belgium from 2010 to 2026 – split by applications
Table 25: Demand for plastic caps and closures in Belgium from 2010 to 2026 – split by closure types
Table 26: Production, import, and export of and demand for plastic caps and closures in Belgium from 2010 to 2026
Table 27: Important manufacturers of plastic caps and closures in Belgium
Table 28: Demand for plastic caps and closures in Bulgaria from 2010 to 2026 – split by applications
Table 29: Demand for plastic caps and closures in Bulgaria from 2010 to 2026 – split by closure types
Table 30: Production, import, and export of and demand for plastic caps and closures in Bulgaria from 2010 to 2026
Table 31: Demand for plastic caps and closures in Czechia from 2010 to 2026 – split by applications
Table 32: Demand for plastic caps and closures in Czechia from 2010 to 2026 – split by closure types
Table 33: Production, import, and export of and demand for plastic caps and closures in Czechia from 2010 to 2026
Table 34: Demand for plastic caps and closures in Finland from 2010 to 2026 – split by applications
Table 35: Demand for plastic caps and closures in Finland from 2010 to 2026 – split by closure types
Table 36: Production, import, and export of and demand for plastic caps and closures in Finland from 2010 to 2026
Table 37: Demand for plastic caps and closures in France from 2010 to 2026 – split by applications
Table 38: Demand for plastic caps and closures in France from 2010 to 2026 – split by closure types
Table 39: Production, import, and export of and demand for plastic caps and closures in France from 2010 to 2026
Table 40: Important manufacturers of plastic caps and closures in France
Table 41: Demand for plastic caps and closures in Germany from 2010 to 2026 – split by applications
Table 42: Demand for plastic caps and closures in Germany from 2010 to 2026 – split by closure types
Table 43: Production, import, and export of and demand for plastic caps and closures in Germany from 2010 to 2026
Table 44: Important manufacturers of plastic caps and closures in Germany
Table 45: Demand for plastic caps and closures in Greece from 2010 to 2026 – split by applications
Table 46: Demand for plastic caps and closures in Greece from 2010 to 2026 – split by closure types
Table 47: Production, import, and export of and demand for plastic caps and closures in Greece from 2010 to 2026
Table 48: Demand for plastic caps and closures in Hungary from 2010 to 2026 – split by applications
Table 49: Demand for plastic caps and closures in Hungary from 2010 to 2026 – split by closure types
Table 50: Production, import, and export of and demand for plastic caps and closures in Hungary from 2010 to 2026
Table 51: Demand for plastic caps and closures in Italy from 2010 to 2026 – split by applications
Table 52: Demand for plastic caps and closures in Italy from 2010 to 2026 – split by closure types
Table 53: Production, import, and export of and demand for plastic caps and closures in Italy from 2010 to 2026
Table 54: Important manufacturers of plastic caps and closures in Italy
Table 55: Demand for plastic caps and closures in Lithuania from 2010 to 2026 – split by applications
Table 56: Demand for plastic caps and closures in Lithuania from 2010 to 2026 – split by closure types
Table 57: Production, import, and export of and demand for plastic caps and closures in Lithuania from 2010 to 2026
Table 58: Demand for plastic caps and closures in Poland from 2010 to 2026 – split by applications
Table 59: Demand for plastic caps and closures in Poland from 2010 to 2026 – split by closure types
Table 60: Production, import, and export of and demand for plastic caps and closures in Poland from 2010 to 2026
Table 61: Demand for plastic caps and closures in Portugal from 2010 to 2026 – split by applications
Table 62: Demand for plastic caps and closures in Portugal from 2010 to 2026 – split by closure types
Table 63: Production, import, and export of and demand for plastic caps and closures in Portugal from 2010 to 2026
Table 64: Demand for plastic caps and closures in Romania from 2010 to 2026 – split by applications
Table 65: Demand for plastic caps and closures in Romania from 2010 to 2026 – split by closure types
Table 66: Production, import, and export of and demand for plastic caps and closures in Romania from 2010 to 2026
Table 67: Demand for plastic caps and closures in Russia from 2010 to 2026 – split by applications
Table 68: Demand for plastic caps and closures in Russia from 2010 to 2026 – split by closure types
Table 69: Production, import, and export of and demand for plastic caps and closures in Russia from 2010 to 2026
Table 70: Demand for plastic caps and closures in Slovakia from 2010 to 2026 – split by applications
Table 71: Demand for plastic caps and closures in Slovakia from 2010 to 2026 – split by closure types
Table 72: Production, import, and export of and demand for plastic caps and closures in Slovakia from 2010 to 2026
Table 73: Demand for plastic caps and closures in Spain from 2010 to 2026 – split by applications
Table 74: Demand for plastic caps and closures in Spain from 2010 to 2026 – split by closure types
Table 75: Production, import, and export of and demand for plastic caps and closures in Spain from 2010 to 2026
Table 76: Important manufacturers of plastic caps and closures in Spain
Table 77: Demand for plastic caps and closures in Sweden from 2010 to 2026 – split by applications
Table 78: Demand for plastic caps and closures in Sweden from 2010 to 2026 – split by closure types
Table 79: Production, import, and export of and demand for plastic caps and closures in Sweden from 2010 to 2026
Table 80: Demand for plastic caps and closures in Switzerland from 2010 to 2026 – split by applications
Table 81: Demand for plastic caps and closures in Switzerland from 2010 to 2026 – split by closure types
Table 82: Production, import, and export of and demand for plastic caps and closures in Switzerland from 2010 to 2026
Table 83: Important manufacturers of plastic caps and closures in Switzerland
Table 84: Demand for plastic caps and closures in the Netherlands from 2010 to 2026 – split by applications
Table 85: Demand for plastic caps and closures in the Netherlands from 2010 to 2026 – split by closure types
Table 86: Production, import, and export of and demand for plastic caps and closures in the Netherlands from 2010 to 2026
Table 87: Important manufacturers of plastic caps and closures in the Netherlands
Table 88: Demand for plastic caps and closures in Turkey from 2010 to 2026 – split by applications
Table 89: Demand for plastic caps and closures in Turkey from 2010 to 2026 – split by closure types
Table 90: Production, import, and export of and demand for plastic caps and closures in Turkey from 2010 to 2026
Table 91: Demand for plastic caps and closures in the United Kingdom from 2010 to 2026 – split by applications
Table 92: Demand for plastic caps and closures in the United Kingdom from 2010 to 2026 – split by closure types
Table 93: Production, import, and export of and demand for plastic caps and closures in the United Kingdom from 2010 to 2026
Table 94: Important manufacturers of plastic caps and closures in the United Kingdom
Table 95: Demand for plastic caps and closures in the remaining European countries from 2010 to 2026 – split by applications
Table 96: Demand for plastic caps and closures in the remaining European countries from 2010 to 2026 – split by closure types
Table 97: Production, import, and export of and demand for plastic caps and closures in the remaining European countries from 2010 to 2026
Table 98: Important manufacturers of plastic caps and closures in the remaining European countries


