

Description
This study is currently being completely revised. We plan to publish the 5th edition in April 2024. Therefore we can offer you the update for free, if you order the current edition now.
The Plastic Windows Market Report – World is now also available in parts (e.g. individual country profiles or all manufacturer profiles). Please feel free to contact us and we will immediately send you an offer for your specific selection.
The construction sector and its suppliers are being hit – somewhat delayed – by the drastic measures to contain the Corona epidemic and by the consequences of the Ukraine war. Ceresana has studied the global market for plastic windows used in buildings. The current study, the fourth global market report on plastic windows, provides a quantitative assessment of the impact of the crisis and the magnitudes and timeframes of a possible recovery. Ceresana expects demand for plastic windows to start growing again from 2023, especially for renovation and non-residential construction: the analysts anticipate average global growth of 1.8% p.a. until 2031.
Current Market Data on Plastic Windows
Compared to products made of aluminum or wood, windows made of PVC or other plastics are very durable, robust and easy to maintain. The market share of plastic windows is increasing almost everywhere in the world. They play an important role in automated ventilation, heat regulation and burglary protection in the context of “smart homes”. The new study by Ceresana provides figures on demand, production, import and export of plastic windows (in millions of units) as well as information on revenues (in billion USD and EUR). The decisive factor is the number of window frames (but not the window hardware or glazing). The development of the individual construction segments is also examined in detail: New construction, renovation, residential construction and non-residential construction.
Plastic Windows for Climate Protection
Since many orders are currently being postponed or have failed to be placed altogether, especially in non-residential construction, e.g., for new hotels, the construction industry now heavily depends on public tenders. The financial strength and priorities of government financiers vary greatly from country to country. National markets for plastic windows are heavily influenced by energy efficiency incentives. Heating buildings accounts for a large proportion of total energy demand. Therefore, the insulation of house walls or roofs is often demanded. However, the best insulation is of little use if windows are ignored as potential thermal bridges. Modern plastic windows can make an important contribution to saving energy and protecting the environment, for example by integrating special insulating cores directly into the window profile to reduce heat loss and thus the energy requirements of a house.
The Study in Brief:
Chapter 1 provides a complete quantitative representation and analysis of the global market for plastic windows, including forecasts up to 2031. Key figures such as production and demand (in millions of units) and revenue (in USD and EUR) are given for each region of the world.
In Chapter 2 the production and demand of plastic windows for 16 countries is presented in figures, also divided into construction segments:
- New Construction
- Renovation
- Residential Construction
- Non-Residential Construction
Additionally, key figures on imports, exports and revenue are provided.
Chapter 3 offers company profiles of the most important manufacturers of plastic windows, clearly arranged by contact details, revenues, profit, product range, production sites, short profiles as well as product types and application areas. Detailed profiles are provided by the most important 74 manufacturers, such as Andersen Corp., Jeld-Wen, Inc., LIXIL Group Corp., Rehau AG + Co., Schüco International KG, Veka AG, VKR Holding AS, Weru GmbH, and YKK AP, Inc.
Scope of the Report:
Attributes | Details |
| Base Year | 2021 |
| Trend Period | 2022 – 2031 |
| Forecast Period | 2020 – 2027 |
| Pages | 260 |
| Application Areas | New Construction, Renovation, Residential Construction, Commercial Construction |
| Company Profiles | Andersen Corp, Jeld-Wen, Inc, LIXIL Group Corp, Rehau AG + Co, Schüco International KG, Veka AG, VKR Holding AS, Weru GmbH and YKK AP, Inc (selection). |
| Edition | 4th edition |
| Publication | August 2022 |
FAQs
What will be the growth rate of the plastic windows market until 2031?
The global average growth rate is expected to be 1.8% per year.
In which application areas is the demand for plastic windows expected to increase the most?
A strong increase in demand is expected for the renovation and non-residential construction segments in particular.
1 Market Data: World and Regions
1.1 World
1.1.1 Demand
1.1.2 Revenues
1.1.3 Production
1.1.4 Construction Segments
1.2 Western Europe
1.2.1 Demand
1.2.2 Revenues
1.2.3 Production
1.2.4 Construction Segments
1.3 Eastern Europe
1.3.1 Demand
1.3.2 Revenues
1.3.3 Production
1.3.4 Construction Segments
1.4 North America
1.4.1 Demand
1.4.2 Revenues
1.4.3 Production
1.4.4 Construction Segments
1.5 South America
1.5.1 Demand
1.5.2 Revenues
1.5.3 Production
1.5.4 Construction Segments
1.6 Asia-Pacific
1.6.1 Demand
1.6.2 Revenues
1.6.3 Production
1.6.4 Construction Segments
1.7 Middle East / Africa
1.7.1 Demand
1.7.2 Revenues
1.7.3 Production
1.7.4 Construction Segments
2 Market Data: Countries
2.1 Western Europe
2.1.1 France
2.1.2 Germany
2.1.3 Italy
2.1.4 Spain
2.1.5 United Kingdom
2.1.6 Other Western Europe
2.2 Eastern Europe
2.2.1 Poland
2.2.2 Russia
2.2.3 Turkey
2.2.4 Other Eastern Europe
2.3 North America
2.3.1 Canada
2.3.2 Mexico
2.3.3 USA
2.4 South America
2.4.1 Brazil
2.4.2 Other South America
2.5 Asia-Pacific
2.5. China
2.5.2 India
2.5.3 Japan
2.5.4 South Korea
2.5.5 Other Asia-Pacific
3 Company Profiles
3.1 Western Europe
Austria (4 Producers)
Belgium (1)
Denmark (1)
France (4)
Germany (12)
Ireland (1)
Italy (3)
Sweden (1)
United Kingdom (2)
3.2 Eastern Europe
Poland (4)
Russia (1)
Turkey (1)
3.3 North America
Canada (6)
USA (24)
3.4 Asia Pacific
China (6)
India (1)
Japan (2)
*Note: The profiles are assigned to the country in which the company or holding is headquartered. Profiles also include JVs and subsidiaries.
Graph 1: Global demand for plastic windows from 2019 to 2031
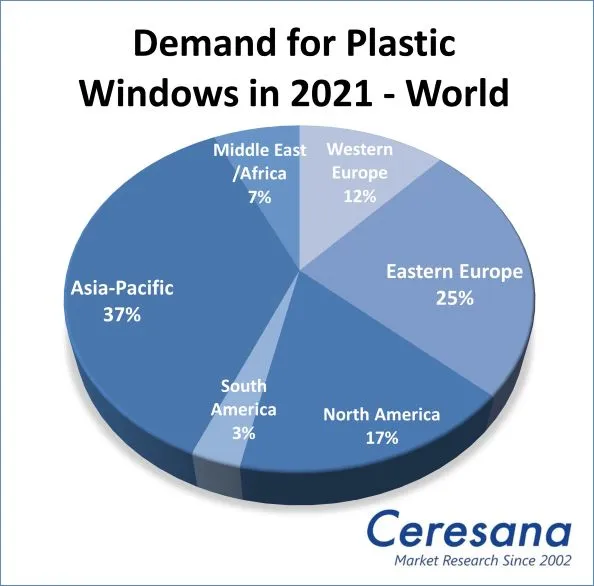
Graph 2: Global demand for plastic windows from 2019 to 2031 – split by regions
Graph 3: Global revenues generated with plastic windows from 2019 to 2031, in billion USD and billion EUR
Graph 4: Global revenues generated with plastic windows from 2019 to 2031 in billion USD – split by regions
Graph 5: Global revenues generated with plastic windows from 2019 to 2031 in billion EUR – split by regions
Graph 6: Global production of plastic windows from 2019 to 2031
Graph 7: Global production of plastic windows from 2019 to 2031 – split by regions
Graph 8: Global demand for plastic windows from 2019 to 2031 – split by construction segments
Graph 9: Global demand for plastic windows in the segment new construction from 2019 to 2031 – split by regions
Graph 10: Global demand for plastic windows in the segment renovation from 2019 to 2031 – split by regions
Graph 11: Global demand for plastic windows in the segment residential construction from 2019 to 2031 – split by regions
Graph 12: Global demand for plastic windows in the segment non-residential construction from 2019 to 2031 – split by regions
Graph 13: Demand for plastic windows in Western Europe from 2019 to 2031
Graph 14: Revenues generated with plastic windows in Western Europe from 2019 to 2031, in billion USD and billion EUR
Graph 15: Production of plastic windows in Western Europe from 2019 to 2031
Graph 16: Demand for plastic windows in Western Europe from 2019 to 2031 – split by construction segments
Graph 17: Demand for plastic windows in Eastern Europe from 2019 to 2031
Graph 18: Revenues generated with plastic windows in Eastern Europe from 2019 to 2031, in billion USD and billion EUR
Graph 19: Production of plastic windows in Eastern Europe from 2019 to 2031
Graph 20: Demand for plastic windows in Eastern Europe from 2019 to 2031 – split by construction segments
Graph 21: Demand for plastic windows in North America from 2019 to 2031
Graph 22: Revenues generated with plastic windows in North America from 2019 to 2031 in billion USD and billion EUR
Graph 23: Production of plastic windows in North America from 2019 to 2031
Graph 24: Demand for plastic windows in North America from 2019 to 2031 – split by construction segments
Graph 25: Demand for plastic windows in South America from 2019 to 2031
Graph 26: Revenues generated with plastic windows in South America from 2019 to 2031 in billion USD and billion EUR
Graph 27: Production of plastic windows in South America from 2019 to 2031
Graph 28: Demand for plastic windows in South America from 2019 to 2031 – split by construction segments
Graph 29: Demand for plastic windows in Asia-Pacific from 2019 to 2031
Graph 30: Revenues generated with plastic windows in Asia-Pacific from 2019 to 2031, in billion USD and billion EUR
Graph 31: Production of plastic windows in Asia-Pacific from 2019 to 2031
Graph 32: Demand for plastic windows in Asia-Pacific from 2019 to 2031 – split by construction segments
Graph 33: Demand for plastic windows in the Middle East / Africa from 2019 to 2031
Graph 34: Revenues generated with plastic windows in the Middle East / Africa from 2019 to 2031 in billion USD and billion EUR
Graph 35: Production of plastic windows in the Middle East / Africa from 2019 to 2031
Graph 36: Demand for plastic windows in the region Middle East / Africa from 2019 to 2031 – split by construction segments
Graph 37: Demand for plastic windows in France from 2019 to 2031
Graph 38: Production of plastic windows in France from 2019 to 2031
Graph 39: Demand for plastic windows in Germany from 2019 to 2031
Graph 40: Production of plastic windows in Germany from 2019 to 2031
Graph 41: Demand for plastic windows in Italy from 2019 to 2031
Graph 42: Production of plastic windows in Italy from 2019 to 2031
Graph 43: Demand for plastic windows in Spain from 2019 to 2031
Graph 44: Production of plastic windows in Spain from 2019 to 2031
Graph 45: Demand for plastic windows in the United Kingdom from 2019 to 2031
Graph 46: Production of plastic windows in the United Kingdom from 2019 to 2031
Graph 47: Demand for plastic windows in Other Western Europe from 2019 to 2031
Graph 48: Production of plastic windows in the remaining countries of Western Europe from 2019 to 2031
Graph 49: Demand for plastic windows in Poland from 2019 to 2031
Graph 50: Production of plastic windows in Poland from 2019 to 2031
Graph 51: Demand for plastic windows in Russia from 2019 to 2031
Graph 52: Production of plastic windows in Russia from 2019 to 2031
Graph 53: Demand for plastic windows in Turkey from 2019 to 2031
Graph 54: Production of plastic windows in Turkey from 2019 to 2031
Graph 55: Demand for plastic windows in Other Eastern Europe from 2019 to 2031
Graph 56: Production of plastic windows in Other Eastern Europe from 2019 to 2031
Graph 57: Demand for plastic windows in Canada from 2019 to 2031
Graph 58: Production of plastic windows in Canada from 2019 to 2031
Graph 59: Demand for plastic windows in Mexico from 2019 to 2031
Graph 60: Production of plastic windows in Mexico from 2019 to 2031
Graph 61: Demand for plastic windows in the USA from 2019 to 2031
Graph 62: Production of plastic windows in the USA from 2019 to 2031
Graph 63: Demand for plastic windows in Brazil from 2019 to 2031
Graph 64: Production of plastic windows in Brazil from 2019 to 2031
Graph 65: Demand for plastic windows in the remaining countries of South America from 2019 to 2031
Graph 66: Production of plastic windows in the remaining countries of South America from 2019 to 2031
Graph 67: Demand for plastic windows in China from 2019 to 2031
Graph 68: Production of plastic windows in China from 2019 to 2031
Graph 69: Demand for plastic windows in India from 2019 to 2031
Graph 70: Production of plastic windows in India from 2019 to 2031
Graph 71: Demand for plastic windows in Japan from 2019 to 2031
Graph 72: Production of plastic windows in Japan from 2019 to 2031
Graph 73: Demand for plastic windows in South Korea from 2019 to 2031
Graph 74: Production of plastic windows in South Korea from 2019 to 2031
Graph 75: Demand for plastic windows in the remaining countries of Asia-Pacific from 2019 to 2031
Graph 76: Production of plastic windows in the remaining countries of Asia-Pacific from 2019 to 2031
Table 1: Global demand for plastic windows from 2019 to 2031 – split by regions
Table 2: Global revenues generated with plastic windows from 2019 to 2031 in billion USD – split by regions
Table 3: Global revenues generated with plastic windows from 2019 to 2031 in billion EUR – split by regions
Table 4: Global production of plastic windows from 2019 to 2031 – split by regions
Table 5: Global demand for plastic windows from 2019 to 2031 – split by construction segments
Table 6: Global demand for plastic windows in the segment new construction from 2019 to 2031 – split by regions
Table 7: Global demand for plastic windows in the segment renovation from 2019 to 2031 – split by regions
Table 8: Global demand for plastic windows in the segment residential construction from 2019 to 2031 – split by regions
Table 9: Global demand for plastic windows in the segment non-residential construction from 2019 to 2031 – split by regions
Table 10: Demand for plastic windows in Western Europe from 2019 to 2031 – split by major countries
Table 11: Revenues generated with plastic windows in Western Europe from 2019 to 2031 in billion USD and billion EUR
Table 12: Production of plastic windows in Western Europe from 2019 to 2031 – split by major countries
Table 13: Demand for plastic windows in Western Europe from 2019 to 2031 – split by construction segments
Table 14: Demand for plastic windows in Eastern Europe from 2019 to 2031 – split by major countries
Table 15: Revenues generated with plastic windows in Eastern Europe from 2019 to 2031 in billion USD and billion EUR
Table 16: Production of plastic windows in Eastern Europe from 2019 to 2031 – split by major countries
Table 17: Demand for plastic windows in Eastern Europe from 2019 to 2031 – split by construction segments
Table 18: Demand for plastic windows in North America from 2019 to 2031 – split by major countries
Table 19: Revenues generated with plastic windows in North America from 2019 to 2031 in billion USD and billion EUR
Table 20: Production of plastic windows in North America from 2019 to 2031 – split by major countries
Table 21: Demand for plastic windows in North America from 2019 to 2031 – split by construction segments
Table 22: Demand for plastic windows in South America from 2019 to 2031 – split by major countries
Table 23: Revenues generated with plastic windows in South America from 2019 to 2031 in billion USD and billion EUR
Table 24: Production of plastic windows in South America from 2019 to 2031 – split by major countries
Table 25: Demand for plastic windows in South America from 2019 to 2031 – split by construction segments
Table 26: Demand for plastic windows in Asia-Pacific from 2019 to 2031 – split by major countries
Table 27: Revenues generated with plastic windows in Asia-Pacific from 2019 to 2031 in billion USD and billion EUR
Table 28: Production of plastic windows in Asia-Pacific from 2019 to 2031 – split by major countries
Table 29: Demand for plastic windows in Asia-Pacific from 2019 to 2031 – split by construction segments
Table 30: Revenues generated with plastic windows in the Middle East / Africa from 2019 to 2031, in billion USD and billion EUR
Table 31: Demand for plastic windows in the region Middle East / Africa from 2019 to 2031 – split by construction segments
Table 32: Revenues generated with plastic windows in France from 2019 to 2031, in billion USD and billion EUR
Table 33: Demand for plastic windows in France from 2019 to 2031 – split by construction segments
Table 34: Production, import, and export of and demand for plastic windows in France from 2019 to 2031
Table 35: Revenues generated with plastic windows in Germany from 2019 to 2031, in billion USD and billion EUR
Table 36: Demand for plastic windows in Germany from 2019 to 2031 – split by construction segments
Table 37: Production, import, and export of and demand for plastic windows in Germany from 2019 to 2031
Table 38: Revenues generated with plastic windows in Italy from 2019 to 2031 in billion USD and billion EUR
Table 39: Demand for plastic windows in Italy from 2019 to 2031 – split by construction segments
Table 40: Production, import, and export of and demand for plastic windows in Italy from 2019 to 2031
Table 41: Revenues generated with plastic windows in Spain from 2019 to 2031, in billion USD and billion EUR
Table 42: Demand for plastic windows in Spain from 2019 to 2031 – split by construction segments
Table 43: Production, import, and export of and demand for plastic windows in Spain from 2019 to 2031
Table 44: Revenues generated with plastic windows in the United Kingdom from 2019 to 2031, in billion USD and billion EUR
Table 45: Demand for plastic windows in the United Kingdom from 2019 to 2031 – split by construction segments
Table 46: Production, import, and export of and demand for plastic windows in the United Kingdom from 2019 to 2031
Table 47: Revenues generated with plastic windows in Other Western Europe from 2019 to 2031 in billion USD and billion EUR
Table 48: Demand for plastic windows in the remaining countries of Western Europe from 2019 to 2031 – split by construction segments
Table 49: Production, import, and export of and demand for plastic windows in the remaining countries of Western Europe from 2019 to 2031
Table 50: Revenues generated with plastic windows in Poland from 2019 to 2031, in billion USD and billion EUR
Table 51: Demand for plastic windows in Poland from 2019 to 2031 – split by construction segments
Table 52: Production, import, and export of and demand for plastic windows in Poland from 2019 to 2031
Table 53: Revenues generated with plastic windows in Russia from 2019 to 2031 in billion USD and billion EUR
Table 54: Demand for plastic windows in Russia from 2019 to 2031 – split by construction segment
Table 55: Production, import, and export of and demand for plastic windows in Russia from 2019 to 2031
Table 56: Revenues generated with plastic windows in Turkey from 2019 to 2031 in billion USD and billion EUR
Table 57: Demand for plastic windows in Turkey from 2019 to 2031 – split by construction segments
Table 58: Production, import, and export of and demand for plastic windows in Turkey from 2019 to 2031
Table 59: Revenues generated with plastic windows in the remaining countries of Eastern Europe from 2019 to 2031 in billion USD and billion EUR
Table 60: Demand for plastic windows in Other Eastern Europe from 2019 to 2031 – split by construction segments
Table 61: Production, import, and export of and demand for plastic windows in the remaining countries of Eastern Europe from 2019 to 2031
Table 62: Revenues generated with plastic windows in Canada from 2019 to 2031 in billion USD and billion EUR
Table 63: Demand for plastic windows in Canada from 2019 to 2031 – split by construction segments
Table 64: Production, import, and export of and demand for plastic windows in Canada from 2019 to 2031
Table 65: Revenues generated with plastic windows in Mexico from 2019 to 2031 in billion USD and billion EUR
Table 66: Demand for plastic windows in Mexico from 2019 to 2031 – split by construction segments
Table 67: Production, import, and export of and demand for plastic windows in Mexico from 2019 to 2031
Table 68: Revenues generated with plastic windows in the USA from 2019 to 2031 in billion USD and billion EUR
Table 69: Demand for plastic windows in the USA from 2019 to 2031 – split by construction segments
Table 70: Production, import, and export of and demand for plastic windows in the USA from 2019 to 2031
Table 71: Revenues generated with plastic windows in Brazil from 2019 to 2031, in billion USD and billion EUR
Table 72: Demand for plastic windows in Brazil from 2019 to 2031 – split by construction segments
Table 73: Production, import, and export of and demand for plastic windows in Brazil from 2019 to 2031
Table 74: Revenues generated with plastic windows in the remaining countries of South America from 2019 to 2031 in billion USD and billion EUR
Table 75: Demand for plastic windows in Other South America from 2019 to 2031 – split by construction segments
Table 76: Production, import, and export of and demand for plastic windows in the remaining countries of South America from 2019 to 2031
Table 77: Revenues generated with plastic windows in China from 2019 to 2031 in billion USD and billion EUR
Table 78: Demand for plastic windows in China from 2019 to 2031 – split by construction segments
Table 79: Production, import, and export of and demand for plastic windows in China from 2019 to 2031
Table 80: Revenues generated with plastic windows in India from 2019 to 2031, in billion USD and billion EUR
Table 81: Demand for plastic windows in India from 2019 to 2031 – split by construction segments
Table 82: Production, import, and export of and demand for plastic windows in India from 2019 to 2031
Table 83: Revenues generated with plastic windows in Japan from 2019 to 2031, in billion USD and billion EUR
Table 84: Demand for plastic windows in Japan from 2019 to 2031 – split by construction segments
Table 85: Production, import, and export of and demand for plastic windows in Japan from 2019 to 2031
Table 86: Revenues generated with plastic windows in South Korea from 2019 to 2031, in billion USD and billion EUR
Table 87: Demand for plastic windows in South Korea from 2019 to 2031 – split by construction segments
Table 88: Production, import, and export of and demand for plastic windows in South Korea from 2019 to 2031
Table 89: Revenues generated with plastic windows in Other Asia-Pacific from 2019 to 2031 in billion USD and billion EUR
Table 90: Demand for plastic windows in the remaining countries of Asia-Pacific from 2019 to 2031 – split by construction segments
Table 91: Production, import, and export of and demand for plastic windows in the remaining countries of Asia-Pacific from 2019 to 2031


