

Description
This study is currently being completely revised. We plan to publish the 6th edition in July 2024. Therefore we can offer you the update for free, if you order the current edition now.
The Adhesives Market Report – Europe is now also available in parts (e.g. individual country profiles or all manufacturer profiles). Please feel free to contact us and we will immediately send you an offer for your specific selection.
Failures can become success stories. Cyanoacrylate was completely unusable as a transparent plastic – but as a superglue, the fast-curing material is now constantly inspiring new users: climate demonstrators use it to glue themselves to roads, doctors spray wound dressings, forensic technicians secure fingerprints. Adhesive technology is highly innovative and is conquering more and more areas of application. The adhesives market report has now examined the market for adhesives in Europe for the fifth time: In 2021, the total demand of vinyl, acrylic, polyurethane, elastomer, epoxy and other adhesive types in 23 European countries, including Russia, the Caucasus and Turkey, amounted to around 3.2 million tonnes.
This study looks in detail at vinyl, acrylic, polyurethane, elastomer, epoxy and other adhesive types. For 22 individual European countries, including Russia, Caucasus countries and Turkey, information is provided on demand, production, import and export of adhesives since 2019 – and forecasts up to 2031. Volumes are given in tonnes, and revenues in both USD and EUR.
Not covered here are sealants, cement, mortar, and phenol and other formaldehyde condensates. → Ceresana offers its own market study on sealants and adhesives made of polyurethane (PUR).
Proven and Innovative Applications
The most important sales market for adhesives is the paper and packaging segment, which accounts for around 30% of total European demand. Due to stagnating private consumption, Ceresana market researchers do not expect a recovery in this area until 2024. The construction industry, the second largest market for adhesives, is also currently experiencing a significant slump. The automotive industry, which is increasingly replacing screws, rivets and welding with adhesives, is also relying on innovative joining technology: Around 18 kilograms of adhesives are used in a new car, and around 250 kilograms in a bus – from the protective layers of the battery cells to the crash-proof windows. Adhesives enable lightweight construction not only in aircraft, but also in ships, for example. Other major applications for adhesives are wood processing, leather, shoes and other consumer products.
Sticky Vinyls
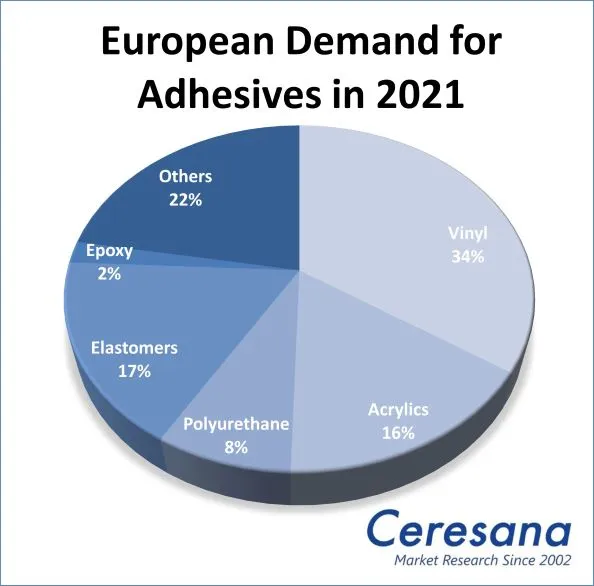
The most significant adhesive type in terms of volume is currently vinyl products, which offer a particularly wide range of applications. The most important grades include adhesives based on polyvinyl acetate (PVAC). Additionally, polyvinyl acetate is used to produce polyvinyl alcohol (PVA), which is also used as an adhesive for porous materials such as paper, cardboard, wood, cork or leather. The main consumers of vinyl adhesives are the paper, packaging, wood products and construction industries. They mainly use water-based products and hot melt adhesives.
Wanted: Environmentally Friendly Adhesives
Adhesives sometimes contain large quantities of solvents that can evaporate from bonded surfaces or from containers. Organic solvents, especially aromatic hydrocarbons such as xylene or toluene, are not only a fire hazard but also a health hazard because their vapors are addictive and can cause cancer. For this reason, more environmentally compatible alternatives are increasingly being sought. In Europe, water-based adhesives already accounted for around 52% of total consumption in 2021. If an adhesive contains only water as a solvent, however, preservatives have to be added, which in turn can be problematic for people with allergies.
The Study in Brief:
Chapter 1 of Ceresana’s new study provides a comprehensive presentation and analysis of the European adhesives market – including forecasts up to 2031: for each country, the development of sales, demand per application, trade, and production are detailed.
For the 8 largest countries in Europe, market data is broken down in detail for the different adhesive types and adhesive technologies:
- waterborne adhesives
- hot melts
- solvent-borne adhesives
- reactive adhesives
- other technologies.
Chapter 2 thoroughly analyzes the different applications of adhesives, their respective data and influencing factors:
- paper and packaging
- construction
- wood processing
- transportation
- shoes and leather
- consumer products
- other applications.
It also looks at demand for individual adhesive types:
- Vinyl
- Acrylic
- Polyurethane (PUR)
- Elastomers
- Epoxy
- Other Adhesives.
Chapter 3 provides a useful manufacturer directory with the 83 most important adhesive producers in Europe, clearly arranged by contact details, revenues, profits, product range, production sites, brief profile and specific information on adhesives. The adhesive manufacturers featured include: 3M Europe N.V., AkzoNobel N.V., Bolton Group, Compagnie de Saint-Gobain S.A., Dow Europe GmbH, H.B. Fuller Europe GmbH, Henkel AG & Co. KGaA, Lohmann GmbH & Co. KG, and tesa SE.
Scope of the Report:
Attributes | Details |
Base Year | 2021 |
Trend Period | 2019 – 2031 |
Forecast Period | 2022 – 2031 |
Pages | 260 |
Adhesive Technologies | Water-Based Adhesives, Hotmelt Adhesives, Solvent-Based Adhesives, Reactive Adhesives, Other Technologies |
Adhesive Types | Vinyl, Acrylic, Polyurethane (PUR), Elastomers, Epoxy, Other Adhesives |
Company Profiles | 3M, AkzoNobel, Bolton, Dow, Fuller, Henkel, Lohmann, Saint-Gobain, and tesa. (Selection) |
Edition | 5th edition |
Publication | December 2022 |
FAQs
What was the amount of adhesives consumed in Europe in 2021?
In 2021, the total demand adhesives amounted to around 3.2 million tonnes.
What are the most important sales markets for adhesives?
The most important sales market for adhesives is the paper and packaging segment, which accounts for around 30% of total European demand.
Which type of plastic is in highest demand?
The most significant adhesive type in terms of volume is currently vinyl products.
1 Market Data: Europe
1.1 Demand
1.2 Revenues
1.3 Production
1.4 Demand Split by Application Areas
1.4.1 Paper and Packaging
1.4.2 Construction Industry
1.4.3 Wood Processing
1.4.4 Transportation Industry
1.4.5 Shoes and Leather
1.4.6 Consumer Goods
1.4.7 Others
1.5 Demand Split by Products
1.5.1 Vinyl
1.5.2 Acrylic
1.5.3 Polyurethane (PUR)
1.5.4 Elastomers
1.5.5 Epoxy
1.5.6 Others
1.6 Demand Split by Technologies
1.6.1 Waterborne Adhesives
1.6.2 Hot Melts
1.6.3 Solvent Borne Adhesives
1.6.4 Reactive Adhesives
1.6.5 Others
2 Market Data: Countries
(For each country: Revenues, production and trade. As well as demand per products and applications and for the Top 8 per Technologies)
2.1 Austria
2.2 Belgium
2.3 Czechia
2.4 Denmark
2.5 Finland
2.6 France
2.7 Germany
2.8 Greece
2.9 Hungary
2.10 Italy
2.11 Lithuania
2.12 Poland
2.13 Portugal
2.14 Romania
2.15 Russia
2.16 Slovakia
2.17 Spain
2.18 Sweden
2.19 Switzerland
2.20 The Netherlands
2.21 Turkey
2.22 United Kingdom
2.23 Rest of Europe
3 Company Profiles*
Austria (1 Producer)
Belgium (4)
Estonia (1)
Finland (1)
France (6)
Germany (27)
Ireland (1)
Italy (5)
Luxemburg (1)
Norway (1)
Poland (4)
Portugal (1)
Slovakia (1)
Slovenia (2)
Spain (2)
Sweden (1)
Switzerland (11)
The Netherlands (5)
Turkey (3)
United Kingdom (5)
*Note: The profiles are assigned to the country in which the company or holding is headquartered. Profiles also include JVs and subsidiaries.
Graph 1: Demand in Europe from 2019 to 2031
Graph 2: Revenues generated in Europe from 2019 to 2031 in billion USD and billion EUR
Graph 3: Production in Europe from 2019 to 2031
Graph 4: Demand in Austria from 2019 until 2031
Graph 5: Production in Austria from 2019 to 2031
Graph 6: Demand in Belgium from 2019 to 2031
Graph 7: Production in Belgium from 2019 to 2031
Graph 8: Demand in Czechia from 2019 to 2031
Graph 9: Production in Czechia from 2019 to 2031
Graph 10: Demand in Denmark from 2019 to 2031
Graph 11: Production in Denmark from 2019 to 2031
Graph 12: Demand in Finland from 2019 to 2031
Graph 13: Production in Finland from 2019 to 2031
Graph 14: Demand in France from 2019 to 2031
Graph 15: Production in France from 2019 to 2031
Graph 16: Demand in Germany from 2019 to 2031
Graph 17: Production in Germany from 2019 to 2031
Graph 18: Demand in Greece from 2019 to 2031
Graph 19: Production in Greece from 2019 to 2031
Graph 20: Demand in Hungary from 2019 to 2031
Graph 21: Production in Hungary from 2019 to 2031
Graph 22: Demand in Italy from 2019 to 2031
Graph 23: Production in Italy from 2019 to 2031
Graph 24: Demand in Lithuania from 2019 to 2031
Graph 25: Production in Lithuania from 2019 to 2031
Graph 26: Demand in Poland from 2019 to 2031
Graph 27: Production in Poland from 2019 to 2031
Graph 28: Demand in Portugal from 2019 to 2031
Graph 29: Production in Portugal from 2019 to 2031
Graph 30: Demand in Romania from 2019 to 2031
Graph 31: Production in Romania from 2019 to 2031
Graph 32: Demand in Russia from 2019 to 2031
Graph 33: Production in Russia from 2019 to 2031
Graph 34: Demand in Slovakia from 2019 to 2031
Graph 35: Production in Slovakia from 2019 to 2031
Graph 36: Demand in Spain from 2019 to 2031
Graph 37: Production in Spain from 2019 to 2031
Graph 38: Demand in Sweden from 2019 to 2031
Graph 39: Production in Sweden from 2019 to 2031
Graph 40: Demand in Switzerland from 2019 to 2031
Graph 41: Production in Switzerland from 2019 to 2031
Graph 42: Demand in the Netherlands from 2019 to 2031
Graph 43: Production in the Netherlands from 2019 to 2031
Graph 44: Demand in Turkey from 2019 to 2031
Graph 45: Production in Turkey from 2019 to 2031
Graph 46: Demand in the United Kingdom from 2019 to 2031
Graph 47: Production in the United Kingdom from 2019 to 2031
Graph 48: Demand in the remaining European countries from 2019 to 2031
Graph 49: Production in the remaining European countries from 2019 to 2031
Table 1: European demand from 2019 to 2031 – split by countries
Table 2: Production in Europe from 2019 to 2031 – split by countries
Table 3: European demand from 2019 to 2031 – split by applications
Table 4: European demand in the segment paper/packaging from 2019 to 2031 – split by countries
Table 5: European demand in the segment construction from 2019 to 2031 – split by countries
Table 6: European demand in the segment wood processing from 2019 to 2031 – split by countries
Table 7: European demand in the segment transportation from 2019 to 2031 – split by countries
Table 8: European demand in the segment shoes and leather from 2019 to 2031 – split by countries
Table 9: European demand in the segment consumer goods from 2019 to 2031 – split by countries
Table 10: European demand in other applications from 2019 to 2031 – split by countries
Table 11: Demand in Europe from 2019 to 2031 – split by products
Table 12: European demand for vinyl adhesives from 2019 to 2031 – split by countries
Table 13: European demand for acrylic adhesives from 2019 to 2031 – split by countries
Table 14: European demand for polyurethane adhesives from 2019 to 2031 – split by countries
Table 15: European demand for elastomer adhesives from 2019 to 2031 – split by countries
Table 16: European demand for epoxy adhesives from 2019 to 2031 – split by countries
Table 17: European demand for other adhesives from 2019 to 2031 – split by countries
Table 18: European demand from 2019 to 2031 – split by technologies
Table 19: European demand for waterborne adhesives from 2019 to 2031 – split by countries
Table 20: European demand for hot melts from 2019 to 2031 – split by countries
Table 21: European demand for solvent borne adhesives from 2019 to 2031 – split by countries
Table 22: European demand for reactive adhesives from 2019 to 2031 – split by countries
Table 23: European demand for other adhesives from 2019 to 2031 – split by countries
Table 24: Revenues generated in Austria from 2019 to 2031 in million USD and million EUR
Table 25: Demand in Austria from 2019 to 2031 – split by applications
Table 26: Production, import, export and demand in Austria from 2019 to 2031
Table 27: Revenues generated in Belgium from 2019 to 2031 in million USD and million EUR
Table 28: Demand in Belgium from 2019 to 2031 – split by applications
Table 29: Production, import, export and demand in Belgium from 2019 to 2031
Table 30: Revenues generated in Czechia from 2019 to 2031, in million USD and million EUR
Table 31: Demand in Czechia from 2019 to 2031 – split by applications
Table 32: Production, import, export and demand in Czechia from 2019 to 2031
Table 33: Revenues generated in Denmark from 2019 to 2031 in million USD and million EUR
Table 34: Demand in Denmark from 2019 to 2031 – split by applications
Table 35: Production, import, export and demand in Denmark from 2019 to 2031
Table 36: Revenues generated in Finland from 2019 to 2031 in million USD and million EUR
Table 37: Demand in Finland from 2019 to 2031 – split by applications
Table 38: Production, import, export and demand in Finland from 2019 to 2031
Table 39: Revenues generated in France from 2019 to 2031, in million USD and million EUR
Table 40: Demand in France from 2019 to 2031 – split by applications
Table 41: Demand in France from 2019 to 2031 – split by products
Table 42: Demand in France from 2019 to 2031 – split by technologies
Table 43: Production, import, export and demand in France from 2019 to 2031
Table 44: Revenues generated in Germany from 2019 to 2031, in million USD and million EUR
Table 45: Demand in Germany from 2019 to 2031 – split by applications
Table 46: Demand in Germany from 2019 to 2031 – split by products
Table 47: Demand in Germany from 2019 to 2031 – split by technologies
Table 48: Production, import, export and demand in Germany from 2019 to 2031
Table 49: Revenues generated in Greece from 2019 to 2031 in million USD and million EUR
Table 50: Demand in Greece from 2019 to 2031 – split by applications
Table 51: Production, import, export and demand in Greece from 2019 to 2031
Table 52: Revenues generated in Hungary from 2019 to 2031 in million USD and million EUR
Table 53: Demand in Hungary from 2019 to 2031 – split by applications
Table 54: Production, import, export and demand in Hungary from 2019 to 2031
Table 55: Revenues generated in Italy from 2019 to 2031, in million USD and million EUR
Table 56: Demand in Italy from 2019 to 2031 – split by applications
Table 57: Demand in Italy from 2019 to 2031 – split by products
Table 58: Demand in Italy from 2019 to 2031 – split by technologies
Table 59: Production, import, export and demand in Italy from 2019 to 2031
Table 60: Revenues generated in Lithuania from 2019 to 2031, in million USD and million EUR
Table 61: Demand in Lithuania from 2019 to 2031 – split by applications
Table 62: Production, import, export and demand in Lithuania from 2019 to 2031
Table 63: Revenues generated in Poland from 2019 to 2031, in million USD and million EUR
Table 64: Demand in Poland from 2019 to 2031 – split by applications
Table 65: Demand in Poland from 2019 to 2031 – split by products
Table 66:Demand in Poland from 2019 to 2031 – split by technologies
Table 67: Production, import, export and demand in Poland from 2019 to 2031
Table 68: Revenues generated in Portugal from 2019 to 2031 in million USD and million EUR
Table 69: Demand in Portugal from 2019 to 2031 – split by applications
Table 70: Production, import, export and demand in Portugal from 2019 to 2031
Table 71: Revenues generated in Romania from 2019 to 2031 in million USD and million EUR
Table 72: Demand in Romania from 2019 to 2031 – split by applications
Table 73: Production, import, export and demand in Romania from 2019 to 2031
Table 74: Revenues generated in Russia from 2019 to 2031, in million USD and million EUR
Table 75: Demand in Russia from 2019 to 2031 – split by applications
Table 76: Demand in Russia from 2019 to 2031 – split by products
Table 77: Demand in Russia from 2019 to 2031 – split by technologies
Table 78: Production, import, export and demand in Russia from 2019 to 2031
Table 79: Revenues generated in Slovakia from 2019 to 2031 in million USD and million EUR
Table 80: Demand in Slovakia from 2019 to 2031 – split by applications
Table 81: Production, import, export and demand in Slovakia from 2019 to 2031
Table 82: Revenues generated in Spain from 2019 to 2031, in million USD and million EUR
Table 83: Demand in Spain from 2019 to 2031 – split by applications
Table 84: Demand in Spain from 2019 to 2031 – split by products
Table 85:Demand in Spain from 2019 to 2031 – split by technologies
Table 86: Production, import, export and demand in Spain from 2019 to 2031
Table 87: Revenues generated in Sweden from 2019 to 2031 in million USD and million EUR
Table 88: Demand in Sweden from 2019 to 2031 – split by applications
Table 89: Production, import, export and demand in Sweden from 2019 to 2031
Table 90: Revenues generated in Switzerland from 2019 to 2031 in million USD and million EUR
Table 91: Demand in Switzerland from 2019 to 2031 – split by applications
Table 92: Production, import, export and demand in Switzerland from 2019 to 2031
Table 93: Revenues generated in the Netherlands from 2019 to 2031 in million USD and million EUR
Table 94: Demand in the Netherlands from 2019 to 2031 – split by applications
Table 95: Production, import, export and demand in the Netherlands from 2019 to 2031
Table 96: Revenues generated in Turkey from 2019 to 2031, in million USD and million EUR
Table 97: Demand in Turkey from 2019 to 2031 – split by applications
Table 98: Demand in Turkey from 2019 to 2031 – split by products
Table 99: Demand in Turkey from 2019 to 2031 – split by technologies
Table 100: Production, import, export and demand in Turkey from 2019 to 2031
Table 101: Revenues generated in the United Kingdom from 2019 to 2031, in million USD and million EUR
Table 102: Demand in the United Kingdom from 2019 to 2031 – split by applications
Table 103: Demand in the United Kingdom from 2019 to 2031 – split by products
Table 104: Demand in the United Kingdom from 2019 to 2031 – split by technologies
Table 105: Production, import, export and demand in the United Kingdom from 2019 to 2031
Table 106: Revenues generated in the remaining countries of Europe from 2019 to 2031 in million USD and million EUR
Table 107: Demand in the remaining European countries from 2019 to 2031 – split by applications
Table 108: Production, import, export and demand in the remaining countries of Europe from 2019 to 2031


