

Description
Are you interested in an updated edition? Then please indicate the desired publication date and content in the form. We look forward to responding to you promptly.
The Plasticizers Market Report is now also available in parts (e.g. individual country profiles or all manufacturer profiles). Please feel free to contact us and we will immediately send you an offer for your specific selection.
The world is often hard and brittle, but plasticizers make life easier: Chemicals are added to plastics, elastomers, paints and coatings, adhesives, and also, for example, textiles, deodorants and perfumes to make these materials soft, pliable, stretchable or easier to process. These helpful additives are even among the best-selling chemicals of all: nearly 9 million tonnes are currently sold each year. Ceresana has already analyzed the global market for plasticizers for the seventh time: Market researchers expect demand for these indispensable additives to rise to a total of more than 11 million tonnes by 2032.
Plasticizers for Flexible PVC
Asia-Pacific is by far the region with the highest sales of plasticizers. According to Ceresana’s forecast, this region of the world, which accounts for almost two-thirds of plasticizer consumption today, will continue to record above-average growth rates in the coming years. Demand for plasticizers is also growing by more than 2% pa in Africa and the Middle East, while it is hardly growing at all in Western Europe. Plasticizers are used primarily to make plastic products more pliable, soft and elastic. This application area alone currently requires almost 8 million tonnes per year. The inherently hard and brittle polyvinyl chloride in particular would often be useless without plasticizers: soft PVC consists of up to 50% of plasticizers. Plasticized PVC is processed, for example, into hoses, cables, seals, floor coverings and shoe soles. However, Ceresana expects the greatest growth in plasticizer demand to come from plastic films.
Increasing Demand for Alternatives to Phtalates
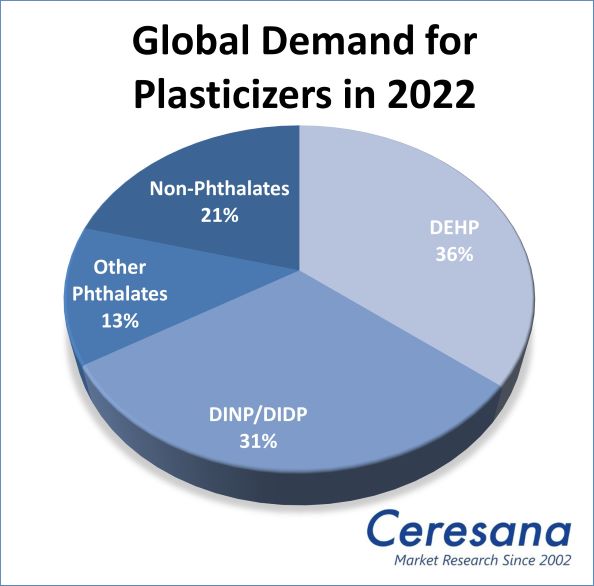
If they are not firmly bound into other materials by copolymerization, plasticizers can evaporate from the end products, wash out or be dispersed by abrasion of plastic particles. Phtalates, which are considered harmful to health and the environment, are now banned for many applications. In Europe, for example, they are banned for children’s toys. Nevertheless, the most widely used type of plasticizer worldwide is still DEHP (bis(2-ethylhexyl) phthalate), with more than 3 million tonnes per year. The two phthalates DINP (diisononyl phthalate) and DIDP (diisodecyl phthalate) together still account for almost a third of the total plasticizer market. But more and more plastics processors are looking for more environmentally friendly alternatives: Ceresana analysts expect demand for phthalate-free plasticizers to increase to around 2.6 million tonnes.
Overview of the Study:
Chapter 1 of Ceresana’s new study analyzes the global plasticizers market – providing forecasts up to 2032. Demand in tonnes and revenues in USD and EUR are outlined for each region of the world. In addition, international and regional demand per product type and per application area is analyzed.
The following plasticizer types are considered in detail: DEHP, DINP and DIDP, other phthalates, plasticizers without phthalates.
The market report examines the various areas of application for plasticizers: profiles, films, cables, floorings, other plastics, elastomers, paints and coatings, adhesives.
Chapter 2 provides figures on both demand and revenues for a total of 44 countries. In addition, a detailed analysis of demand by application area is provided for the individual countries.
Chapter 3 provides useful company profiles of the most important plasticizer manufacturers, clearly arranged according to contact details, revenues, profit, product range, production sites and brief profile. Detailed profiles are provided by 67 manufacturers, for example Arkema S.A., BASF SE, Dow Inc., Eastman Chemical Company, Evonik Industries AG, Kao Corporation, Lanxess AG, LG Chem, Ltd., Mitsubishi Chemical Holdings Corporation, and Nan Ya Plastics Corp.
Scope of the Report:
Attributes | Details |
| Base Year | 2022 |
| Trend Period | 2020 – 2032 |
| Forecast Period | 2023 – 2032 |
| Pages | 300 |
| Plasticizer Types | Bis(2-ethylhexyl)phthalate (DEHP), Diisononyl Phthalate (DINP) and Diisodecyl Phthalate (DIDP), Other Phthalates, Non-Phthalates |
| Application Areas | Profiles, Films, Cables, Floorings, Other Plastics, Elastomers, Paints and Coatings, Adhesives |
| Company Profiles | Arkema S.A., BASF SE, Dow Inc., Eastman Chemical Company, Evonik Industries AG, Kao Corporation, Lanxess AG, LG Chem, Ltd., Mitsubishi Chemical Holdings Corporation, and Nan Ya Plastics Corp. (Selection) |
| Edition | 7th edition |
| Publication | January 2023 |
FAQs
How high will the demand for plasticizers be by 2032?
Global demand for plasticizers will increase to a total of around 11 million tonnes by 2032.
Which region had the highest consumption of plasticizers in 2020?
Asia-Pacific is by far the region with the highest sales of plasticizers.
How is the demand for plasticizers without phthalates developing?
We expect demand for phthalate-free plasticizers to increase to around 2.6 million tonnes.
1 Market Data: World and Regions
1.1 World
1.1.1 Demand
1.1.2 Revenues
1.1.3 Demand Split by Application Areas
1.1.4 Demand Split by Products
1.2 Western Europe
1.2.1 Demand
1.2.2 Revenues
1.2.3 Applications and Products
1.3 Eastern Europe
1.3.1 Demand
1.3.2 Revenues
1.3.3 Applications and Products
1.4 North America
1.4.1 Demand
1.4.2 Revenues
1.4.3 Applications and Products
1.5 South America
1.5.1 Demand
1.5.2 Revenues
1.5.3 Applications and Products
1.6 Asia-Pacific
1.6.1 Demand
1.6.2 Revenues
1.6.3 Applications and Products
1.7 Middle East
1.7.1 Demand
1.7.2 Revenues
1.7.3 Applications and Products
1.8 Africa
1.8.1 Demand
1.8.2 Revenues
1.8.3 Applications and Products
2 Market Data: Countries
2.1 Western Europe
2.1.1 Austria
2.1.2 Belgium
2.1.3 Finland
2.1.4 France
2.1.5 Germany
2.1.6 Italy
2.1.7 Portugal
2.1.8 Spain
2.1.9 Sweden
2.1.10 Switzerland
2.1.11 The Netherlands
2.1.12 United Kingdom
2.1.13 Other Western Europe
2.2 Eastern Europe
2.2.1 Czechia
2.2.2 Greece
2.2.3 Hungary
2.2.4 Poland
2.2.5 Romania
2.2.6 Russia
2.2.7 Slovakia
2.2.8 Turkey
2.2.9 Other Eastern Europe
2.3 North America
2.3.1 Canada
2.3.2 Mexico
2.3.3 USA
2.4 South America
2.4.1 Argentina
2.4.2 Brazil
2.4.3 Chile
2.4.4 Colombia
2.4.5 Peru
2.4.6 Venezuela
2.4.7 Other South America
2.5 Asia-Pacific
2.5.1 Australia
2.5.2 China
2.5.3 India
2.5.4 Indonesia
2.5.5 Japan
2.5.6 Malaysia
2.5.7 South Korea
2.5.8 Taiwan
2.5.9 Thailand
2.5.10 Other Asia-Pacific
2.6 Middle East
2.6.1 Iran
2.6.2 Israel
2.6.3 Pakistan
2.6.4 Saudi Arabia
2.6.5 Other Middle East
2.7 Africa
2.7.1 Egypt
2.7.2 South Africa
2.7.3 Other Africa
3 Company Profiles
3.1 Western Europe
Belgium (1 Producer)
France (2)
Germany (5)
Italy (2)
Sweden (2)
Switzerland (2)
3.2 Eastern Europe
Czechia (1)
Poland (1)
Russia (3)
Turkey (3)
3.3 North America
Mexico (2)
USA (11)
3.4 South America
Argentina (1)
Brazil (3)
Colombia (1)
3.5 Asia-Pacific
China (5)
India (3)
Japan (9)
South Korea (4)
Taiwan (3)
3.6 Middle East
Israel (1)
3.7 Africa
South Africa (2)
*Note: The profiles are assigned to the country in which the company or holding is headquartered. Profiles also include JVs and subsidiaries.
Graph 1: Global demand from 2020 to 2032
Graph 2: Global demand from 2020 to 2032 – split by region
Graph 3: Global revenues from 2020 to 2032 in billion USD and billion EUR
Graph 4: Global revenues from 2020 to 2032 in billion USD – split by region
Graph 5: Global revenues from 2020 to 2032 in billion EUR – split by region
Graph 6: Global demand for plasticizers in the application area “profiles” from 2020 to 2032 – split by region
Graph 7: Global demand for plasticizers in the application area “films” from 2020 to 2032 – split by region
Graph 8: Global demand for plasticizers in the application area “cables” from 2020 to 2032 – split by region
Graph 9: Global demand for plasticizers in the application area “floorings” from 2020 to 2032 – split by region
Graph 10: Global demand for plasticizers in the application area “other plastic products” from 2020 to 2032 – split by region
Graph 11: Global demand for plasticizers in the application area “elastomers” from 2020 to 2032 – split by region
Graph 12: Global demand for plasticizers in the application area “paints and coatings” from 2020 to 2032 – split by region
Graph 13: Global demand in the application area “adhesives” from 2020 to 2032 – split by region
Graph 14: Global demand from 2020 to 2032 – split by product
Graph 15: Global demand for DEHP from 2020 to 2032 – split by region
Graph 16: Global demand for DINP/DIDP from 2020 to 2032 – split by region
Graph 17: Global demand for other phthalates from 2020 to 2032 – split by region
Graph 18: Global demand for non-phthalates from 2020 to 2032 – split by region
Graph 19: Demand in Western Europe from 2020 to 2032
Graph 20: Revenues generated in Western Europe from 2020 to 2032 in billion USD and billion EUR
Graph 21: Demand in Eastern Europe from 2020 to 2032
Graph 22: Revenues in Eastern Europe from 2020 to 2032 in billion USD and billion EUR
Graph 23: Demand in North America from 2020 to 2032
Graph 24: Revenues generated in North America from 2020 to 2032 in billion USD and billion EUR
Graph 25: Demand in South America from 2020 to 2032
Graph 26: Revenues in South America from 2020 to 2032 in billion USD and billion EUR
Graph 27: Demand in Asia-Pacific from 2020 to 2032
Graph 28: Revenues generated in Asia-Pacific from 2020 to 2032 in billion USD and billion EUR
Graph 29: Demand in the Middle East from 2020 to 2032
Graph 30: Revenues in the Middle East from 2020 to 2032 in billion USD and billion EUR
Graph 31: Demand in Africa from 2020 to 2032
Graph 32: Revenues in Africa from 2020 to 2032 in billion USD and billion EUR
Graph 33: Demand in Austria from 2020 to 2032
Graph 34: Demand in Belgium from 2020 to 2032
Graph 35: Demand in Finland from 2020 to 2032
Graph 36: Demand in France from 2020 to 2032
Graph 37: Demand in Germany from 2020 to 2032
Graph 38: Demand in Italy from 2020 to 2032
Graph 39: Demand in Portugal from 2020 to 2032
Graph 40: Demand in Spain from 2020 to 2032
Graph 41: Demand in Sweden from 2020 to 2032
Graph 42: Demand in Switzerland from 2020 to 2032
Graph 43: Demand in the Netherlands from 2020 to 2032
Graph 44: Demand in the United Kingdom from 2020 to 2032
Graph 45: Demand in Other Western Europe from 2020 to 2032
Graph 46: Demand in Czechia from 2020 to 2032
Graph 47: Demand in Greece from 2020 to 2032
Graph 48: Demand in Hungary from 2020 to 2032
Graph 49: Demand in Poland from 2020 to 2032
Graph 50: Demand in Romania from 2020 to 2032
Graph 51: Demand in Russia from 2020 to 2032
Graph 52: Demand in Slovakia from 2020 to 2032
Graph 53: Demand in Turkey from 2020 to 2032
Graph 54: Demand in Other Eastern Europe from 2020 to 2032
Graph 55: Demand in Canada from 2020 to 2032
Graph 56: Demand in Mexico from 2020 to 2032
Graph 57: Demand in the USA from 2020 to 2032
Graph 58: Demand in Argentina from 2020 to 2032
Graph 59: Demand in Brazil from 2020 to 2032
Graph 60: Demand in Chile from 2020 to 2032
Graph 61: Demand in Colombia from 2020 until 2032
Graph 62: Demand in Peru from 2020 to 2032
Graph 63: Demand in Venezuela from 2020 to 2032
Graph 64: Demand in Other South America from 2020 to 2032
Graph 65: Demand in Australia from 2020 to 2032
Graph 66: Demand in China from 2020 to 2032
Graph 67: Demand in India from 2020 to 2032
Graph 68: Demand in Indonesia from 2020 to 2032
Graph 69: Demand in Japan from 2020 to 2032
Graph 70: Demand in Malaysia from 2020 to 2032
Graph 71: Demand in South Korea from 2020 to 2032
Graph 72: Demand in Taiwan from 2020 to 2032
Graph 73: Demand in Thailand from 2020 to 2032
Graph 74: Demand in the remaining countries of Asia-Pacific from 2020 to 2032
Graph 75: Demand in Iran from 2020 to 2032
Graph 76: Demand in Israel from 2020 to 2032
Graph 77: Demand in Pakistan from 2020 to 2032
Graph 78: Demand in Saudi Arabia from 2020 to 2032
Graph 79: Demand in Other Middle East from 2020 to 2032
Graph 80: Demand in Egypt from 2020 to 2032
Graph 81: Demand in South Africa from 2020 to 2032
Graph 82: Demand in Other Africa from 2020 to 2032
Table 1: Global demand from 2020 to 2032 – split by region
Table 2: Global revenues from 2020 to 2032 in million USD – split by region
Table 3: Global revenues from 2020 to 2032 in million EUR – split by region
Table 4: Global demand from 2020 to 2032 – split by application
Table 5: Global demand for plasticizers in the application area “profiles” from 2020 to 2032 – split by region
Table 6: Global demand for plasticizers in the application area “films” from 2020 to 2032 – split by region
Table 7: Global demand for plasticizers in the application area “cables” from 2020 to 2032 – split by region
Table 8: Global demand for plasticizers in the application area “floorings” from 2020 to 2032 – split by region
Table 9: Global demand for plasticizers in the application area “other plastic products” from 2020 to 2032 – split by region
Table 10: Global demand for plasticizers in the application area “elastomers” from 2020 to 2032 – split by region
Table 11: Global demand for plasticizers in the application area “paints and coatings” from 2020 to 2032 – split by region
Table 12: Global demand in the application area “adhesives” from 2020 to 2032 – split by region
Table 13: Global demand from 2020 to 2032 – split by product
Table 14: Global demand for DEHP from 2020 to 2032 – split by region
Table 15: Global demand for DINP/DIDP from 2020 to 2032 – split by region
Table 16: Global demand for other phthalates from 2020 to 2032 – split by region
Table 17: Global demand for non-phthalates from 2020 to 2032 – split by region
Table 18: Demand in Western Europe from 2020 to 2032 – split by major country
Table 19: Revenues generated in Western Europe from 2020 to 2032 in million USD and million EUR
Table 20: Demand in Western Europe from 2020 to 2032 – split by application
Table 21: Demand in Western Europe from 2020 to 2032 – split by product
Table 22: Demand in Eastern Europe from 2020 to 2032 – split by major country
Table 23: Revenues in Eastern Europe from 2020 to 2032 in million USD and million EUR
Table 24: Demand in Eastern Europe from 2020 to 2032 – split by application
Table 25: Demand in Eastern Europe from 2020 to 2032 – split by product
Table 26: Demand in North America from 2020 to 2032 – split by major country
Table 27: Revenues generated in North America from 2020 to 2032 in million USD and million EUR
Table 28: Demand in North America from 2020 to 2032 – split by application
Table 29: Demand in North America from 2020 to 2032 – split by product
Table 30: Demand in South America from 2020 to 2032 – split by major country
Table 31: Revenues in South America from 2020 to 2032 in million USD and million EUR
Table 32: Demand in South America from 2020 to 2032 – split by application
Table 33: Demand in South America from 2020 to 2032 – split by product
Table 34: Demand in Asia-Pacific from 2020 to 2032 – split by major country
Table 35: Revenues generated in Asia-Pacific from 2020 to 2032 in million USD and million EUR
Table 36: Demand in Asia-Pacific from 2020 to 2032 – split by application
Table 37: Demand in Asia-Pacific from 2020 to 2032 – split by product
Table 38: Demand in the Middle East from 2020 to 2032 – split by major country
Table 39: Revenues in the Middle East from 2020 to 2032 in million USD and million EUR
Table 40: Demand in the Middle East from 2020 to 2032 – split by application
Table 41: Demand in the Middle East from 2020 to 2032 – split by product
Table 42: Demand in Africa from 2020 to 2032 – split by major country
Table 43: Revenues in Africa from 2020 to 2032 in million USD and million EUR
Table 44: Demand in Africa from 2020 to 2032 – split by application
Table 45: Demand in Africa from 2020 to 2032 – split by product
Table 46: Revenues generated in Austria from 2020 to 2032 in million USD and million EUR
Table 47: Demand in Austria from 2020 to 2032 – split by application
Table 48: Revenues generated in Belgium from 2020 to 2032 in million USD and million EUR
Table 49: Demand in Belgium from 2020 to 2032 – split by application
Table 50: Revenues generated in Finland from 2020 to 2032 in million USD and million EUR
Table 51: Demand in Finland from 2020 to 2032 – split by application
Table 52: Revenues generated in France from 2020 to 2032 in million USD and million EUR
Table 53: Demand in France from 2020 to 2032 – split by application
Table 54: Revenues in Germany from 2020 to 2032 in million USD and million EUR
Table 55: Demand in Germany from 2020 to 2032 – split by application
Table 56: Revenues generated in Italy from 2020 to 2032 in million USD and million EUR
Table 57: Demand in Italy from 2020 to 2032 – split by application
Table 58: Revenues generated in Portugal from 2020 to 2032 in million USD and million EUR
Table 59: Demand in Portugal from 2020 to 2032 – split by application
Table 60: Revenues in Spain from 2020 to 2032 in million USD and million EUR
Table 61: Demand in Spain from 2020 to 2032 – split by application
Table 62: Revenues generated in Sweden from 2020 to 2032 in million USD and million EUR
Table 63: Demand in Sweden from 2020 to 2032 – split by application
Table 64: Revenues generated in Switzerland from 2020 to 2032 in million USD and million EUR
Table 65: Demand in Switzerland from 2020 to 2032 – split by application
Table 66: Revenues generated in the Netherlands from 2020 to 2032 in million USD and million EUR
Table 67: Demand in the Netherlands from 2020 to 2032 – split by application
Table 68: Revenues in the United Kingdom from 2020 to 2032 in million USD and million EUR
Table 69: Demand in the United Kingdom from 2020 to 2032 – split by application
Table 70: Revenues in Other Western Europe from 2020 to 2032 in million USD and million EUR
Table 71: Demand in Other Western Europe from 2020 to 2032 – split by application
Table 72: Revenues generated in Czechia from 2020 to 2032 in million USD and million EUR
Table 73: Demand in Czechia from 2020 to 2032 – split by application
Table 74: Revenues generated in Greece from 2020 to 2032 in million USD and million EUR
Table 75: Demand in Greece from 2020 to 2032 – split by application
Table 76: Revenues generated in Hungary from 2020 to 2032 in million USD and million EUR
Table 77: Demand in Hungary from 2020 to 2032 – split by application
Table 78: Revenues generated in Poland from 2020 to 2032 in million USD and million EUR
Table 79: Demand in Poland from 2020 to 2032 – split by application
Table 80: Revenues generated in Romania from 2020 to 2032 in million USD and million EUR
Table 81: Demand in Romania from 2020 to 2032 – split by application
Table 82: Revenues generated in Russia from 2020 to 2032 in million USD and million EUR
Table 83: Demand in Russia from 2020 to 2032 – split by application
Table 84: Revenues generated in Slovakia from 2020 to 2032 in million USD and million EUR
Table 85: Demand in Slovakia from 2020 to 2032 – split by application
Table 86: Revenues generated in Turkey from 2020 to 2032 in million USD and million EUR
Table 87: Demand in Turkey from 2020 to 2032 – split by application
Table 88: Revenues in Other Eastern Europe from 2020 to 2032 in billion USD and billion EUR
Table 89: Demand in Other Eastern Europe from 2020 to 2032 – split by application
Table 90: Revenues in Canada from 2020 to 2032 in million USD and million EUR
Table 91: Demand in Canada from 2020 to 2032 – split by application
Table 92: Revenues in Mexico from 2020 to 2032 in million USD and million EUR
Table 93: Demand in Mexico from 2020 to 2032 – split by application
Table 94: Revenues generated in the USA from 2020 to 2032 in million USD and million EUR
Table 95: Demand in the USA from 2020 to 2032 – split by application
Table 96: Revenues generated in Argentina from 2020 to 2032 in million USD and million EUR
Table 97: Demand in Argentina from 2020 to 2032 – split by application
Table 98: Revenues generated in Brazil from 2020 to 2032 in million USD and million EUR
Table 99: Demand in Brazil from 2020 to 2032 – split by application
Table 100: Revenues generated in Chile from 2020 to 2032 in million USD and million EUR
Table 101: Demand in Chile from 2020 to 2032 – split by application
Table 102: Revenues generated in Colombia from 2020 to 2032 in million USD and million EUR
Table 103: Demand in Colombia from 2020 to 2032 – split by application
Table 104: Revenues in Peru from 2020 to 2032 in million USD and million EUR
Table 105: Demand in Peru from 2020 to 2032 – split by application
Table 106: Revenues generated in Venezuela from 2020 to 2032 in million USD and million EUR
Table 107: Demand in Venezuela from 2020 to 2032 – split by application
Table 108: Revenues in Other South America from 2020 to 2032 in million USD and million EUR
Table 109: Demand in Other South America from 2020 to 2032 – split by application
Table 110: Revenues in Australia from 2020 to 2032 in million USD and million EUR
Table 111: Demand in Australia from 2020 to 2032 – split by application
Table 112: Revenues generated in China from 2020 to 2032 in million USD and million EUR
Table 113: Demand in China from 2020 to 2032 – split by application
Table 114: Revenues generated in India from 2020 to 2032 in million USD and million EUR
Table 115: Demand in India from 2020 to 2032 – split by application
Table 116: Revenues generated in Indonesia from 2020 to 2032 in million USD and million EUR
Table 117: Demand in Indonesia from 2020 to 2032 – split by application
Table 118: Revenues in Japan from 2020 to 2032 in million USD and million EUR
Table 119: Demand in Japan from 2020 to 2032 – split by application
Table 120: Revenues generated in Malaysia from 2020 to 2032 in million USD and million EUR
Table 121: Demand in Malaysia from 2020 to 2032 – split by application
Table 122: Revenues generated in South Korea from 2020 to 2032 in million USD and million EUR
Table 123: Demand in South Korea from 2020 to 2032 – split by application
Table 124: Revenues generated in Taiwan from 2020 to 2032 in million USD and million EUR
Table 125: Demand in Taiwan from 2020 to 2032 – split by application
Table 126: Revenues generated in Thailand from 2020 to 2032 in million USD and million EUR
Table 127: Demand in Thailand from 2020 to 2032 – split by application
Table 128: Revenues in the remaining countries of Asia-Pacific from 2020 to 2032 in million USD and million EUR
Table 129: Demand in Other Asia-Pacific from 2020 to 2032 – split by application
Table 130: Revenues generated in Iran from 2020 to 2032 in million USD and million EUR
Table 131: Demand in Iran from 2020 to 2032 – split by application
Table 132: Revenues generated in Israel from 2020 to 2032 in million USD and million EUR
Table 133: Demand in Israel from 2020 to 2032 – split by application
Table 134: Revenues generated in Pakistan from 2020 to 2032 in million USD and million EUR
Table 135: Demand in Pakistan from 2020 to 2032 – split by application
Table 136: Revenues generated in Saudi Arabia from 2020 to 2032 in million USD and million EUR
Table 137: Demand in Saudi Arabia from 2020 to 2032 – split by application
Table 138: Revenues generated in the remaining countries of the Middle East from 2020 to 2032 in million USD and million EUR
Table 139: Demand in Other Middle East from 2020 to 2032 – split by application
Table 140: Revenues generated in Egypt from 2020 to 2032 in million USD and million EUR
Table 141: Demand in Egypt from 2020 to 2032 – split by application
Table 142: Revenues generated in South Africa from 2020 to 2032 in million USD and million EUR
Table 143: Demand in South Africa from 2020 to 2032 – split by application
Table 144: Revenues in Other Africa from 2020 to 2032 in million USD and million EUR
Table 145: Demand in Other Africa from 2020 to 2032 – split by application


