

Description
The Polypropylene Market Report is now also available in parts (e.g. individual country profiles or all manufacturer profiles). Please feel free to contact us and we will immediately send you an offer for your specific selection.
More and more countries are trying to limit the demand for plastic packaging. In Germany, for example, lightweight plastic bags will be banned as of January 2022. Nevertheless, demand for polypropylene (PP) continues to grow. However, this standard plastic is not only used for packaging, but also for numerous other applications – including textile fibers, household appliances and car parts, as well as water pipes and concrete additives. This is the sixth time that Ceresana has analyzed the global market for polypropylene. The latest edition of the polypropylene market analysis forecasts that revenues for this versatile, easily recyclable variety of plastic will grow by an average of 5.6% per year until 2030.
Films, Bags, and Packaging
A total of 19.1 million tonnes of polypropylene were processed into films, bags, sacks and pouches in 2020. This means that flexible packaging is still the most important sales market for this material. A further 17.3 million tonnes were used in the production of rigid packaging, for example for containers and lids for food and beverages, chemicals, industrial and household products. Demand for consumer products and fibers followed on the polypropylene market.
Injection Molding in all Shapes and Colors
Polypropylene is a semi-crystalline thermoplastic polymer. In addition to uniform homopolymers, there are also copolymers, such as random and block copolymers. Homopolymers account for around 67% of global PP demand. Europe and North America use significantly more PP copolymers than other regions. The plastics industry makes particular use of rapid injection molding for polypropylene, especially for producing large numbers of identical items: ranging from disposable and throwaway products to highly complex precision components. The types of molded parts produced are almost unlimited. Nearly 25.7 million tonnes of polypropylene were processed by injection molding in 2020.
The Study in Brief
Chapter 1 provides a comprehensive depiction and analysis of the global market for polypropylene – including forecasts up to 2030: for each region, the development of demand (tonnes), revenue (dollars and euros) and production of the PP industry (tonnes) is presented.
Additionally, the application areas of polypropylene are examined.
The following are considered individually:
- Packaging Films
- Bags & Sacks
- Sack – Heavy Duty / Industry
- Containers – Food
- Containers – Industry / Transport
- Containers – Beverages / Others
- Fibers
- Transportation
- Electrical & Electronics
- Consumer Goods
- Construction
- Others
Chapter 2 of the PP report looks at 27 countries individually: Germany, France, the United Kingdom, Italy, the Netherlands, Spain, Poland, Russia, Turkey, Canada, Mexico, the USA, Argentina, Brazil, China, India, Indonesia, Japan, Malaysia, South Korea, Taiwan, Thailand, Vietnam, Iran, Saudi Arabia, Egypt and South Africa.
The following polypropylene market data is presented:
- Demand
- Revenues
- Import and export
- Production
- Demand for the individual areas of application
- Revenues for the individual areas of application
- Demand per type of product:
- Homopolymer
- Copolymer
- Demand per technology:
- Injection molding
- Films & sheets – extrusion
- Other extrusion
- Other processes
Chapter 3 of the PP market study provides useful company profiles of the most important polypropylene manufacturers, clearly arranged according to contact details, revenues, profit, product range, production sites, capacities and profile summary. Detailed profiles are provided by 94 manufacturers, e.g. Borealis AG, Braskem S.A., China Energy Investment Corporation (China Energy), China Petroleum & Chemical Corp. (Sinopec Corp.), China National Petroleum Corporation (CNPC), ExxonMobil Corporation, LyondellBasell Industries N.V., Reliance Industries Ltd., Saudi Basic Industries Corp. (SABIC), and Total S.A.
Scope of the Report:
Attributes | Details |
| Base Year | 2020 |
| Trend Period | 2018 – 2030 |
| Forecast Period | 2021 – 2030 |
| Pages | 520 |
| Application Areas | Packaging films, bags & sacks, sack – heavy duty / Industry, containers – food, containers – industry / transport, containers – beverages / others, fibers, transportation, electrical & electronics, consumer goods, construction, others |
| Product Type | Homopolymer, Copolymer |
| Technology | Injection molding, films & sheets – extrusion, other extrusion, other processes |
| Company Profiles | Borealis AG, Braskem S.A., China Energy Investment Corporation (China Energy), China Petroleum & Chemical Corp. (Sinopec Corp.), China National Petroleum Corporation (CNPC), ExxonMobil Corporation, LyondellBasell Industries N.V., Reliance Industries Ltd., Saudi Basic Industries Corp. (SABIC), and Total S.A. (Selection) |
| Edition | 6th edition |
| Publication | December 2021 |
FAQs
How is the polypropylene market expected to develop regarding revenues until 2030?
The latest edition of the polypropylene market analysis forecasts that revenues for polypropylene will grow by an average of 5.6% per year until 2030.
What is the most significant sales market for polypropylene?
Flexible packaging is the most important sales market forPP. A total of 19.1 million tons of polypropylene were processed into films, bags, sacks and pouches in 2020.
What is the relationship between the consumption of homopolymers and copolymers?
Homopolymers account for around 67% of global PP demand. In comparison, Europe and North America use significantly more PP copolymers than other regions.
Which technology is particularly used in the plastics industry?
The plastics industry makes particular use of rapid injection molding for polypropylene, especially for producing large numbers of identical items: ranging from disposable and throwaway products to highly complex precision components. The types of molded parts produced are almost unlimited. Nearly 25.7 million tonnes of polypropylene were processed by injection molding in 2020.
1 Market Data: World and Regions
1.1 World
1.1.1 Demand
1.1.2 Revenues
1.1.3 Production
1.1.4 Applications
1.1.4.1 Packaging Films
1.1.4.2 Bags & Sacks
1.1.4.3 Heavy Duty & Industry Sacks
1.1.4.4 Food Containers
1.1.4.5 Containers for Beverages & Other
1.1.4.6 Containers for Industry and Transport
1.1.4.7 Fibers
1.1.4.8 Transportation
1.1.4.9 Electrical and Electronics (E&E)
1.1.4.10 Consumer Goods
1.1.4.11 Construction Industry
1.1.4.12 Other Applications
1.2 Western Europe
1.2.1 Demand
1.2.2 Revenues
1.2.3 Production
1.2.4 Applications, Products, and Technologies
1.3 Eastern Europe
1.3.1 Demand
1.3.2 Revenues
1.3.3 Production
1.3.4 Applications, Products, and Technologies
1.4 North America
1.4.1 Demand
1.4.2 Revenues
1.4.3 Production
1.4.4 Applications, Products, and Technologies
1.5 South America
1.5.1 Demand
1.5.2 Revenues
1.5.3 Production
1.5.4 Applications, Products, and Technologies
1.6 Asia-Pacific
1.6.1 Demand
1.6.2 Revenues
1.6.3 Production
1.6.4 Applications, Products, and Technologies
1.7 Middle East
1.7.1 Demand
1.7.2 Revenues
1.7.3 Production
1.7.4 Applications, Products, and Technologies
1.8 Africa
1.8.1 Demand
1.8.2 Revenues
1.8.3 Production
1.8.4 Applications, Products, and Technologies
2 Market Data: Countries
2.1 Western Europe
2.1.1 France
2.1.1.1 Demand and Revenues
2.1.1.2 Production and Trade
2.1.2 Germany
2.1.2.1 Demand and Revenues
2.1.2.2 Production and Trade
2.1.3 Italy
2.1.3.1 Demand and Revenues
2.1.3.2 Production and Trade
2.1.4 Spain
2.1.4.1 Demand and Revenues
2.1.4.2 Production and Trade
2.1.5 The Netherlands
2.1.5.1 Demand and Revenues
2.1.5.2 Production and Trade
2.1.6 United Kingdom
2.1.6.1 Demand and Revenues
2.1.6.2 Production and Trade
2.1.7 Other Western Europe
2.1.7.1 Demand and Revenues
2.1.7.2 Production and Trade
2.2 Eastern Europe
2.2.1 Poland
2.2.1.1 Demand and Revenues
2.2.1.2 Production and Trade
2.2.2 Russia
2.2.2.1 Demand and Revenues
2.2.2.2 Production and Trade
2.2.3 Turkey
2.2.3.1 Demand and Revenues
2.2.3.2 Production and Trade
2.2.4 Other Eastern Europe
2.2.4.1 Demand and Revenues
2.2.4.2 Production and Trade
2.3 North America
2.3.1 Canada
2.3.1.1 Demand and Revenues
2.3.1.2 Production and Trade
2.3.2 Mexico
2.3.2.1 Demand and Revenues
2.3.2.2 Production and Trade
2.3.3 USA
2.3.3.1 Demand and Revenues
2.3.3.2 Production and Trade
2.4 South America
2.4.1 Argentina
2.4.1.1 Demand and Revenues
2.4.1.2 Production and Trade
2.4.2 Brazil
2.4.2.1 Demand and Revenues
2.4.2.2 Production and Trade
2.4.3 Other South America
2.4.3.1 Demand and Revenues
2.4.3.2 Production and Trade
2.5 Asia-Pacific
2.5.1 China
2.5.1.1 Demand and Revenues
2.5.1.2 Production and Trade
2.5.2 India
2.5.2.1 Demand and Revenues
2.5.2.2 Production and Trade
2.5.3 Indonesia
2.5.3.1 Demand and Revenues
2.5.3.2 Production and Trade
2.5.4 Japan
2.5.4.1 Demand and Revenues
2.5.4.2 Production and Trade
2.5.5 Malaysia
2.5.5.1 Demand and Revenues
2.5.5.2 Production and Trade
2.5.6 South Korea
2.5.6.1 Demand and Revenues
2.5.6.2 Production and Trade
2.5.7 Taiwan
2.5.7.1 Demand and Revenues
2.5.7.2 Production and Trade
2.5.8 Thailand
2.5.8.1 Demand and Revenues
2.5.8.2 Production and Trade
2.5.9 Vietnam
2.5.9.1 Demand and Revenues
2.5.9.2 Production and Trade
2.5.10 Other Asia-Pacific
2.5.10.1 Demand and Revenues
2.5.10.2 Production and Trade
2.6 Middle East
2.6.1 Iran
2.6.1.1 Demand and Revenues
2.6.1.2 Production and Trade
2.6.2 Saudi Arabia
2.6.2.1 Demand and Revenues
2.6.2.2 Production and Trade
2.6.3 Other Middle East
2.6.3.1 Demand and Revenues
2.6.3.2 Production and Trade
2.7 Africa
2.7.1 Egypt
2.7.1.1 Demand and Revenues
2.7.1.2 Production and Trade
2.7.2 South Africa
2.7.2.1 Demand and Revenues
2.7.2.2 Production and Trade
2.7.3 Other Africa
2.7.3.1 Demand and Revenues
2.7.3.2 Production and Trade
3 Company Profiles*
3.1 Western Europe
Austria (1 Producer)
France (2)
Spain (1)
The Netherlands (1)
United Kingdom (1)
3.2 Eastern Europe
Greece (1)
Hungary (1)
Poland (1)
Romania (1)
Russia (5)
Turkey (1)
3.3 North America
Canada (1)
USA (3)
3.4 South America
Argentina (1)
Brazil (1)
Chile (1)
Colombia (1)
3.5 Asia-Pacific
China (25)
India (6)
Indonesia (3)
Japan (4)
South Korea (7)
Taiwan (2)
Thailand (4)
The Philippines (1)
Vietnam (2)
3.6 Middle East
Azerbaijan (1)
Iran (1)
Israel (1)
Kazakhstan (1)
Kuwait (1)
Oman (1)
Saudi Arabia (4)
3.7 Africa
Egypt (2)
Nigeria (2)
South Africa (2)
*Note: The profiles are assigned to the country in which the company or holding is headquartered. Profiles also include JVs and subsidiaries.
Graph 1: Global demand for polypropylene from 2018 to 2030
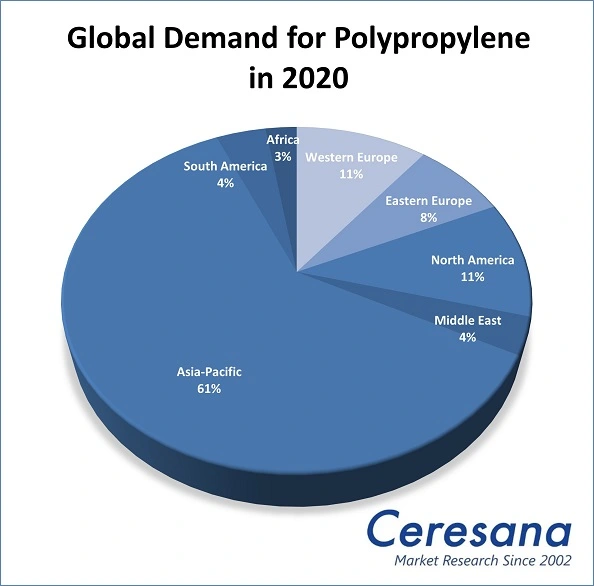
Graph 2: Global demand for polypropylene from 2018 to 2030 – split by regions
Graph 3: Global revenues generated with polypropylene from 2018 to 2030 in billion USD and billion EUR
Graph 4: Global revenues generated with polypropylene from 2020 to 2030 in billion USD – split by regions
Graph 5: Global revenues generated with polypropylene from 2018 to 2030 in billion EUR – split by regions
Graph 6: Global production of polypropylene from 2018 to 2030
Graph 7: Global production of polypropylene from 2018 to 2030 – split by regions
Graph 8: Global demand for polypropylene in packaging films from 2018 to 2030 – split by regions
Graph 9: Global demand for polypropylene in bags & sacks from 2018 to 2030 – split by regions
Graph 10: Global demand for polypropylene in the segment heavy duty & industry sacks from 2018 to 2030 – split by regions
Graph 11: Global demand for polypropylene in the segment food containers from 2018 to 2030 – split by regions
Graph 12: Global demand for polypropylene in the segment containers for beverages and others from 2018 to 2030 – split by regions
Graph 13: Global demand for polypropylene in the segment containers for industry and transport from 2018 to 2030 – split by regions
Graph 14: Global demand for polypropylene in the segment fibers from 2018 to 2030 – split by regions
Graph 15: Global demand for polypropylene in the segment transportation from 2018 to 2030 – split by regions
Graph 16: Global demand for polypropylene in the segment electrical and electronics from 2018 to 2030 – split by regions
Graph 17: Global demand for polypropylene in consumer goods from 2018 to 2030 – split by regions
Graph 18: Global demand for polypropylene in the construction industry from 2018 to 2030 – split by regions
Graph 19: Global demand for polypropylene in other applications from 2018 to 2030 – split by regions
Graph 20: Demand for polypropylene in Western Europe from 2018 to 2030
Graph 21: Revenues generated with polypropylene in Western Europe from 2018 to 2030 in billion USD and billion EUR
Graph 22: Production of polypropylene in Western Europe from 2018 to 2030
Graph 23: Demand for polypropylene in Eastern Europe from 2018 to 2030
Graph 24: Revenues generated with polypropylene in Eastern Europe from 2018 to 2030 in billion USD and billion EUR
Graph 25: Production of polypropylene in Eastern Europe from 2018 to 2030
Graph 26: Demand for polypropylene in North America from 2018 to 2030
Graph 27: Revenues generated with polypropylene in North America from 2018 to 2030 in billion USD and billion EUR
Graph 28: Production of polypropylene in North America from 2018 to 2030
Graph 29: Demand for polypropylene in South America from 2018 to 2030
Graph 30: Revenues generated with polypropylene in South America from 2018 to 2030 in billion USD and billion EUR
Graph 31: Production of polypropylene in South America from 2018 to 2030
Graph 32: Demand for polypropylene in Asia-Pacific from 2018 to 2030
Graph 33: Revenues generated with polypropylene in Asia-Pacific from 2018 to 2030 in billion USD and billion EUR
Graph 34: Production for polypropylene in Asia-Pacific from 2018 to 2030
Graph 35: Demand for polypropylene in the Middle East from 2018 to 2030
Graph 36: Revenues generated with polypropylene in the Middle East from 2018 to 2030 in billion USD and billion EUR
Graph 37: Production of polypropylene in the Middle East from 2018 to 2030
Graph 38: Demand for polypropylene in Africa from 2018 to 2030
Graph 39: Revenues generated with polypropylene in Africa from 2018 to 2030 in billion USD and billion EUR
Graph 40: Production of polypropylene in Africa from 2018 to 2030
Graph 43: Demand for polypropylene in France from 2018 to 2030
Graph 44: Production of polypropylene in France from 2018 to 2030
Graph 41: Demand for polypropylene in Germany from 2018 to 2030
Graph 42: Production of polypropylene in Germany from 2018 to 2030
Graph 47: Demand for polypropylene in Italy from 2018 to 2030
Graph 48: Production of polypropylene in Italy from 2018 to 2030
Graph 51: Demand for polypropylene in Spain from 2018 to 2030
Graph 52: Production of polypropylene in Spain from 2018 to 2030
Graph 49: Demand for polypropylene in the Netherlands from 2018 to 2030
Graph 50: Production of polypropylene in the Netherlands from 2018 to 2030
Graph 45: Demand for polypropylene in the United Kingdom from 2018 to 2030
Graph 46: Production of polypropylene in the United Kingdom from 2018 to 2030
Graph 53: Demand for polypropylene in Other Western Europe from 2018 to 2030
Graph 54: Production of polypropylene in Other Western Europe from 2018 to 2030
Graph 55: Demand for polypropylene in Poland from 2018 to 2030
Graph 56: Production of polypropylene in Poland from 2018 to 2030
Graph 57: Demand for polypropylene in Russia from 2018 to 2030
Graph 58: Production of polypropylene in Russia from 2018 to 2030
Graph 59: Demand for polypropylene in Turkey from 2018 to 2030
Graph 60: Production of polypropylene in Turkey from 2018 to 2030
Graph 61: Demand for polypropylene in Other Eastern Europe from 2018 to 2030
Graph 62: Production of polypropylene in Other Eastern Europe from 2018 to 2030
Graph 63: Demand for polypropylene in Canada from 2018 to 2030
Graph 64: Production of polypropylene in Canada from 2018 to 2030
Graph 65: Demand for polypropylene in Mexico from 2018 to 2030
Graph 66: Production of polypropylene in Mexico from 2018 to 2030
Graph 67: Demand for polypropylene in the USA from 2018 to 2030
Graph 68: Production of polypropylene in the USA from 2018 to 2030
Graph 69: Demand for polypropylene in Argentina from 2018 to 2030
Graph 70: Production of polypropylene in Argentina from 2018 to 2030
Graph 71: Demand for polypropylene in Brazil from 2018 to 2030
Graph 72: Production of polypropylene in Brazil from 2018 to 2030
Graph 73: Demand for polypropylene in Other South America from 2018 to 2030
Graph 74: Production of polypropylene in Other South America from 2018 to 2030
Graph 75: Demand for polypropylene in China from 2018 to 2030
Graph 76: Production of polypropylene in China from 2018 to 2030
Graph 77: Demand for polypropylene in India from 2018 to 2030
Graph 78: Production of polypropylene in India from 2018 to 2030
Graph 79: Demand for polypropylene in Indonesia from 2018 to 2030
Graph 80: Production of polypropylene in Indonesia from 2018 to 2030
Graph 81: Demand for polypropylene in Japan from 2018 to 2030
Graph 82: Production of polypropylene in Japan from 2018 to 2030
Graph 83: Demand for polypropylene in Malaysia from 2018 to 2030
Graph 84: Production of polypropylene in Malaysia from 2018 to 2030
Graph 85: Demand for polypropylene in South Korea from 2018 to 2030
Graph 86: Production of polypropylene in South Korea from 2018 to 2030
Graph 87: Demand for polypropylene in Taiwan from 2018 to 2030
Graph 88: Production of polypropylene in Taiwan from 2018 to 2030
Graph 89: Demand for polypropylene in Thailand from 2018 to 2030
Graph 90: Production of polypropylene in Thailand from 2018 to 2030
Graph 91: Demand for polypropylene in Vietnam from 2018 to 2030
Graph 92: Production of polypropylene in Vietnam from 2018 to 2030
Graph 93: Demand for polypropylene in Other Asia-Pacific from 2018 to 2030
Graph 94: Production of polypropylene in Other Asia-Pacific from 2018 to 2030
Graph 95: Demand for polypropylene in Iran from 2018 to 2030
Graph 96: Production of polypropylene in Iran from 2018 to 2030
Graph 97: Demand for polypropylene in Saudi Arabia from 2018 to 2030
Graph 98: Production of polypropylene in Saudi Arabia from 2018 to 2030
Graph 99: Demand for polypropylene in Other Middle East from 2018 to 2030
Graph 100: Production of polypropylene in Other Middle East from 2018 to 2030
Graph 101: Demand for polypropylene in Egypt from 2018 to 2030
Graph 102: Production of polypropylene in Egypt from 2018 to 2030
Graph 103: Demand for polypropylene in South Africa from 2018 to 2030
Graph 104: Production of polypropylene in South Africa from 2018 to 2030
Graph 105: Demand for polypropylene in Other Africa from 2018 to 2030
Graph 106: Production of polypropylene in Other Africa from 2018 to 2030
Table 1: Global demand for polypropylene from 2018 to 2030 – split by regions
Table 2: Global revenues generated with polypropylene from 2018 to 2030 in billion USD – split by regions
Table 3: Global revenues generated with polypropylene from 2018 to 2030 in billion EUR – split by regions
Table 4: Global production of polypropylene from 2018 to 2030 – split by regions
Table 5: Global demand for polypropylene from 2018 to 2030 – split by applications
Table 6: Global demand for polypropylene in packaging films from 2018 to 2030 – split by regions
Table 7: Global demand for polypropylene in bags & sacks from 2018 to 2030 – split by regions
Table 8: Global demand for polypropylene in the segment heavy duty & industry sacks from 2018 to 2030 – split by regions
Table 9: Global demand for polypropylene in the segment food containers from 2018 to 2030 – split by regions
Table 10: Global demand for polypropylene in the segment containers for beverages and others from 2018 to 2030 – split by regions
Table 11: Global demand for polypropylene in the segment containers for industry and transport from 2018 to 2030 – split by regions
Table 12: Global demand for polypropylene in the segment fibers from 2018 to 2030 – split by regions
Table 13: Global demand for polypropylene in the segment transportation from 2018 to 2030 – split by regions
Table 14: Global demand for polypropylene in the segment electrical and electronics from 2018 to 2030 – split by regions
Table 15: Global demand for polypropylene in consumer goods from 2018 to 2030 – split by regions
Table 16: Global demand for polypropylene in the construction industry from 2018 to 2030 – split by regions
Table 17: Global demand for polypropylene in other applications from 2018 to 2030 – split by regions
Table 18: Demand for polypropylene in Western Europe from 2018 to 2030 – split by major countries
Table 19: Revenues generated with polypropylene in Western Europe from 2018 to 2030 in million USD and million EUR
Table 20: Production of polypropylene in Western Europe from 2018 to 2030 – split by major countries
Table 21: Demand for polypropylene in Western Europe from 2018 to 2030 – split by applications
Table 22: Demand for polypropylene in Western Europe from 2018 to 2030 – split by products
Table 23: Demand for polypropylene in Western Europe from 2018 to 2030 – split by technologies
Table 24: Demand for polypropylene in Eastern Europe from 2018 to 2030 – split by major countries
Table 25: Revenues generated with polypropylene in Eastern Europe from 2018 to 2030 in million USD and million EUR
Table 26: Production of polypropylene in Eastern Europe from 2018 to 2030 – split by major countries
Table 27: Demand for polypropylene in Eastern Europe from 2018 to 2030 – split by products
Table 28: Demand for polypropylene in Eastern Europe from 2018 to 2030 – split by applications
Table 29: Demand for polypropylene in Eastern Europe from 2018 to 2030 – split by technologies
Table 30: Demand for polypropylene in North America from 2018 to 2030 – split by major countries
Table 31: Revenues generated with polypropylene in North America from 2018 to 2030 in million USD and million EUR
Table 32: Production of polypropylene in North America from 2018 to 2030 – split by major countries
Table 33: Demand for polypropylene in North America from 2018 to 2030 – split by products
Table 34: Demand for polypropylene in North America from 2018 to 2030 – split by applications
Table 35: Demand for polypropylene in North America from 2018 to 2030 – split by technologies
Table 36: Demand for polypropylene in South America from 2018 to 2030 – split by major countries
Table 37: Revenues generated with polypropylene in South America from 2018 to 2030 in million USD and million EUR
Table 38: Production of polypropylene in South America from 2018 to 2030 – split by major countries
Table 39: Demand for polypropylene in South America from 2018 to 2030 – split by applications
Table 40: Demand for polypropylene in South America from 2018 to 2030 – split by products
Table 41: Demand for polypropylene in South America from 2018 to 2030 – split by technologies
Table 42: Demand for polypropylene in Asia-Pacific from 2018 to 2030 – split by major countries
Table 43: Revenues generated with polypropylene in Asia-Pacific from 2018 to 2030 in million USD and million EUR
Table 44: Production of polypropylene in Asia-Pacific from 2018 to 2030 – split by major countries
Table 45: Demand for polypropylene in Asia-Pacific from 2018 to 2030 – split by products
Table 46: Demand for polypropylene in Asia-Pacific from 2018 to 2030 – split by technologies
Table 47: Demand for polypropylene in Asia-Pacific from 2018 to 2030 – split by applications
Table 48: Demand for polypropylene in the Middle East from 2018 to 2030 – split by major countries
Table 49: Revenues generated with polypropylene in the Middle East from 2018 to 2030 in million USD and million EUR
Table 50: Production of polypropylene in the Middle East from 2018 to 2030 – split by major countries
Table 51: Demand for polypropylene in the Middle East from 2018 to 2030 — split by applications
Table 52: Demand for polypropylene in the Middle East from 2018 to 2030 — split by products
Table 54: Demand for polypropylene in Africa from 2018 to 2030 – split by major countries
Table 55: Revenues generated with polypropylene in Africa from 2018 to 2030 in million USD and million EUR
Table 56: Production of polypropylene in Africa from 2018 to 2030 – split by major countries
Table 57: Demand for polypropylene in Africa from 2018 to 2030 – split by applications
Table 58: Demand for polypropylene in Africa from 2018 to 2030 – split by products
Table 66: Revenues generated with polypropylene in France from 2018 to 2030 in million USD and million EUR
Table 67: Demand for polypropylene in France from 2018 to 2030 – split by applications
Table 68: Demand for polypropylene in France from 2018 to 2030 – split by products
Table 69: Demand for polypropylene in France from 2018 to 2030 – split by technologies
Table 70: Revenues generated with polypropylene in France from 2018 to 2030 in million USD – split by applications
Table 71: Production, import, and export of and demand for polypropylene in France from 2018 to 2030
Table 60: Revenues generated with polypropylene in Germany from 2018 to 2030 in million USD and million EUR
Table 61: Demand for polypropylene in Germany from 2018 to 2030 – split by applications
Table 62: Demand for polypropylene in Germany from 2018 to 2030 – split by polypropylene products
Table 63: Demand for polypropylene in Germany from 2018 to 2030 – split by technologies
Table 64: Revenues generated with polypropylene in Germany from 2018 to 2030 in million USD – split by applications
Table 65: Production, import, and export of and demand for polypropylene in Germany from 2018 to 2030
Table 78: Revenues generated with polypropylene in Italy from 2018 to 2030 in million USD and million EUR
Table 79: Demand for polypropylene in Italy from 2018 to 2030 – split by applications
Table 80: Demand for polypropylene in Italy from 2018 to 2030 – split by products
Table 81: Demand for polypropylene in Italy from 2018 to 2030 – split by technologies
Table 82: Revenues generated with polypropylene in Italy from 2018 to 2030 in million USD – split by applications
Table 83: Production, import, and export of and demand for polypropylene in Italy from 2018 to 2030
Table 90: Revenues generated with polypropylene in Spain from 2018 to 2030 in million USD and million EUR
Table 91: Demand for polypropylene in Spain from 2018 to 2030 – split by applications
Table 92: Demand for polypropylene in Spain from 2018 to 2030 – split by products
Table 93: Demand for polypropylene in Spain from 2018 to 2030 – split by technologies
Table 94: Revenues generated with polypropylene in Spain from 2018 to 2030 in million USD – split by applications
Table 95: Production, import, and export of and demand for polypropylene in Spain from 2018 to 2030
Table 84: Revenues generated with polypropylene in the Netherlands from 2018 to 2030 in million USD and million EUR
Table 85: Demand for polypropylene in the Netherlands from 2018 to 2030 – split by applications
Table 86: Demand for polypropylene in the Netherlands from 2018 to 2030 – split by products
Table 87: Demand for LLDPE in the Netherlands from 2010 to 2026 – split by technologies
Table 88: Revenues generated with polypropylene in the Netherlands from 2018 to 2030 in million USD – split by applications
Table 89: Production, import, and export of and demand for polypropylene in the Netherlands from 2018 to 2030
Table 72: Revenues generated with polypropylene in the United Kingdom from 2018 to 2030 in million USD and million EUR
Table 73: Demand for polypropylene in the United Kingdom from 2018 to 2030 – split by applications
Table 74: Demand for polypropylene in the United Kingdom from 2018 to 2030 – split by products
Table 75: Demand for polypropylene in the United Kingdom from 2018 to 2030 – split by technologies
Table 76: Revenues generated with polypropylene in the United Kingdom from 2018 to 2030 in million USD – split by applications
Table 77: Production, import, and export of and demand for polypropylene in the United Kingdom from 2018 to 2030
Table 96: Revenues generated with polypropylene in the remaining countries of Western Europe from 2018 to 2030 in million USD and million EUR
Table 97: Demand for polypropylene in Other Western Europe from 2018 to 2030 – split by applications
Table 98: Demand for polypropylene in Other Western Europe from 2018 to 2030 – split by products
Table 99: Demand for polypropylene in Other Western Europe from 2018 to 2030 – split by technologies
Table 100: Revenues generated with polypropylene in other Western European countries from 2018 to 2030 in million USD – split by applications
Table 101: Production, import, and export of and demand for polypropylene in the remaining countries of Western Europe from 2018 to 2030
Table 102: Revenues generated with polypropylene in Poland from 2018 to 2030 in million USD and million EUR
Table 103: Demand for polypropylene in Poland from 2018 to 2030 – split by applications
Table 104: Demand for polypropylene in Poland from 2018 to 2030 – split by products
Table 105: Demand for polypropylene in Poland from 2018 to 2030 – split by technologies
Table 106: Revenues generated with polypropylene in Poland from 2018 to 2030 in million USD – split by applications
Table 107: Production, import, and export of and demand for polypropylene in Poland from 2018 to 2030
Table 108: Revenues generated with polypropylene in Russia from 2018 to 2030 in million USD and million EUR
Table 109: Demand for EPS in Russia from 2018 to 2030 – split by applications
Table 110: Demand for polypropylene in Russia from 2018 to 2030 – split by products
Table 111: Demand for polypropylene in Russia from 2018 to 2030 – split by technologies
Table 112: Revenues generated with polypropylene in Russia from 2018 to 2030 in million USD – split by applications
Table 113: Production, import, and export of and demand for polypropylene in Russia from 2018 to 2030
Table 114: Revenues generated with polypropylene in Turkey from 2018 to 2030 in million USD and million EUR
Table 115: Demand for polypropylene in Turkey 2018 to 2030– split by applications
Table 116: Demand for polypropylene in Turkey from 2018 to 2030 – split by products
Table 117: Demand for polypropylene in Turkey from 2018 to 2030 – split by technologies
Table 118: Revenues generated with polypropylene in Turkey from 2018 to 2030 in million USD – split by applications
Table 119: Production, import, and export of and demand for polypropylene in Turkey from 2018 to 2030
Table 120: Revenues generated with polypropylene in the remaining countries of Eastern Europe from 2018 to 2030 in billion USD and billion EUR
Table 121: Demand for polypropylene in Other Eastern Europe from 2018 to 2030 – split by applications
Table 122: Demand for polypropylene in Other Eastern Europe from 2018 to 2030 – split by products
Table 123: Demand for polypropylene in Other Eastern Europe from 2018 to 2030 – split by technologies
Table 124: Revenues generated with polypropylene in other Eastern European countries from 2018 to 2030 in million USD – split by applications
Table 125: Production, import, and export of and demand for polypropylene in the remaining countries of Eastern Europe from 2018 to 2030
Table 126: Revenues generated with polypropylene in Canada from 2018 to 2030 in million USD and million EUR
Table 127: Demand for polypropylene in Canada from 2018 to 2030 – split by applications
Table 128: Demand for polypropylene in Canada from 2018 to 2030 – split by products
Table 129: Demand for polypropylene in Canada from 2018 to 2030 – split by technologies
Table 130: Revenues generated with polypropylene in Canada from 2018 to 2030 in million USD – split by applications
Table 131: Production, import, and export of and demand for polypropylene in Canada from 2018 to 2030
Table 132: Revenues generated with EPS in Mexico from 2018 to 2030 in million USD and million EUR
Table 133: Demand for polypropylene in Mexico from 2018 to 2030 – split by applications
Table 134: Demand for polypropylene in Mexico from 2018 to 2030 – split by products
Table 135: Demand for polypropylene in Mexico from 2018 to 2030 – split by technologies
Table 136: Revenues generated with polypropylene in Mexico from 2018 to 2030 in million USD – split by products
Table 137: Production, import, and export of and demand for polypropylene in Mexico from 2018 to 2030
Table 138: Revenues generated with polypropylene in the USA from 2018 to 2030 in million USD and million EUR
Table 139: Demand for polypropylene in the USA from 2018 to 2030 – split by applications
Table 140: Demand for polypropylene in the USA from 2018 to 2030 – split by products
Table 141: Demand for polypropylene in the USA from 2018 to 2030 – split by technologies
Table 142: Revenues generated with polypropylene in the USA from 2018 to 2030 in million USD – split by applications
Table 143: Production, import, and export of and demand for polypropylene in the USA from 2018 to 2030
Table 144: Revenues generated with polypropylene in Argentina from 2018 to 2030 in million USD and million EUR
Table 145: Demand for polypropylene in Argentina from 2018 to 2030 – split by applications
Table 146: Demand for polypropylene in Argentina from 2018 to 2030 – split by products
Table 147: Demand for polypropylene in Argentina from 2018 to 2030 – split by technologies
Table 148: Revenues generated with polypropylene in Argentina from 2018 to 2030 in million USD – split by applications
Table 149: Production, import, and export of and demand for polypropylene in Argentina from 2018 to 2030
Table 150: Revenues generated with polypropylene in Brazil from 2018 to 2030 in million USD and million EUR
Table 151: Demand for polypropylene in Brazil from 2018 to 2030 – split by applications
Table 152: Demand for polypropylene in Brazil from 2018 to 2030 – split by products
Table 153: Demand for polypropylene in Brazil from 2018 to 2030 – split by technologies
Table 154: Revenues generated with polypropylene in Brazil from 2018 to 2030 in million USD – split by applications
Table 155: Production, import, and export of and demand for polypropylene in Brazil from 2018 to 2030
Table 156: Revenues generated with polypropylene in the remaining countries of South America from 2018 to 2030 in million USD and million EUR
Table 157: Demand for polypropylene in Other South America from 2018 to 2030– split by applications
Table 158: Demand for polypropylene in Other South America from 2018 to 2030– split by products
Table 159: Demand for polypropylene in Other South America from 2018 to 2030– split by technologies
Table 160: Revenues generated with polypropylene in other South American countries from 2018 to 2030 in million USD – split by applications
Table 161: Production, import, and export of and demand for polypropylene in the remaining countries of South America from 2018 to 2030
Table 162: Revenues generated with polypropylene in China from 2018 to 2030 in million USD and million EUR
Table 163: Demand for polypropylene in China from 2018 to 2030 – split by applications
Table 164: Demand for polypropylene in China from 2018 to 2030 – split by products
Table 165: Demand for polypropylene in China from 2018 to 2030 – split by technologies
Table 166: Revenues generated with polypropylene in China from 2018 to 2030 in million USD – split by applications
Table 167: Production, import, and export of and demand for polypropylene in China from 2018 to 2030
Table 168: Revenues generated with polypropylene in India from 2018 to 2030 in million USD and million EUR
Table 169: Demand for polypropylene in India from 2018 to 2030 – split by applications
Table 170: Demand for polypropylene in India from 2018 to 2030 – split by products
Table 171: Demand for polypropylene in India from 2018 to 2030 – split by technologies
Table 172: Revenues generated with polypropylene in India from 2018 to 2030 in million USD – split by applications
Table 173: Production, import, and export of and demand for polypropylene in India from 2018 to 2030
Table 174: Revenues generated with polypropylene in Indonesia from 2018 to 2030 in million USD and million EUR
Table 175: Demand for polypropylene in Indonesia from 2018 to 2030 – split by applications
Table 176: Demand for polypropylene in Indonesia from 2018 to 2030 – split by products
Table 177: Demand for polypropylene in Indonesia from 2018 to 2030 – split by technologies
Table 178: Revenues generated with polypropylene in Indonesia from 2018 to 2030 in million USD – split by products
Table 179: Production, import, and export of and demand for polypropylene in Indonesia from 2018 to 2030
Table 180: Revenues generated with polypropylene in Japan from 2018 to 2030 in million USD and million EUR
Table 181: Demand for polypropylene in Japan from 2018 to 2030 – split by applications
Table 182: Demand for polypropylene in Japan from 2018 to 2030 – split by products
Table 183: Demand for polypropylene in Japan from 2018 to 2030 – split by technologies
Table 184: Revenues generated with polypropylene in Japan from 2018 to 2030 in million USD – split by applications
Table 185: Production, import, and export of and demand for polypropylene in Japan from 2018 to 2030
Table 186: Revenues generated with polypropylene in Malaysia from 2018 to 2030 in million USD and million EUR
Table 187: Demand for polypropylene in Malaysia from 2018 to 2030 – split by applications
Table 188: Demand for polypropylene in Malaysia from 2018 to 2030 – split by products
Table 189: Demand for polypropylene in Malaysia from 2018 to 2030 – split by technologies
Table 190: Revenues generated with polypropylene in Malaysia from 2018 to 2030 in million USD – split by applications
Table 191: Production, import, and export of and demand for polypropylene in Malaysia from 2018 to 2030
Table 192: Revenues generated with polypropylene in South Korea from 2018 to 2030 in million USD and million EUR
Table 193: Demand for polypropylene in South Korea from 2018 to 2030 – split by applications
Table 194: Demand for polypropylene in South Korea from 2018 to 2030 – split by products
Table 195: Demand for polypropylene in South Korea from 2018 to 2030 – split by technologies
Table 196: Revenues generated with polypropylene in South Korea from 2018 to 2030 in million USD – split by applications
Table 197: Production, import, and export of and demand for polypropylene in South Korea from 2018 to 2030
Table 198: Revenues generated with polypropylene in Taiwan from 2018 to 2030 in million USD and million EUR
Table 199: Demand for polypropylene in Taiwan from 2018 to 2030 – split by applications
Table 200: Demand for polypropylene in Taiwan from 2018 to 2030 – split by products
Table 201: Demand for polypropylene in Taiwan from 2018 to 2030 – split by technologies
Table 202: Revenues generated with polypropylene in Taiwan from 2018 to 2030 in million USD – split by applications
Table 203: Production, import, and export of and demand for polypropylene in Taiwan from 2018 to 2030
Table 204: Revenues generated with polypropylene in Thailand from 2018 to 2030 in million USD and million EUR
Table 205: Demand for polypropylene in Thailand from 2018 to 2030 – split by applications
Table 206: Demand for polypropylene in Thailand from 2018 to 2030 – split by products
Table 207: Demand for polypropylene in Thailand from 2018 to 2030 – split by technologies
Table 208: Revenues generated with polypropylene in Thailand from 2018 to 2030 in million USD – split by applications
Table 209: Production, import, and export of and demand for polypropylene in Thailand from 2018 to 2030
Table 210: Revenues generated with polypropylene in Vietnam from 2018 to 2030 in million USD and million EUR
Table 211: Demand for polypropylene in Vietnam from 2018 to 2030 – split by applications
Table 212: Demand for polypropylene in Vietnam from 2018 to 2030 – split by products
Table 213: Demand for polypropylene in Vietnam from 2018 to 2030 – split by technologies
Table 214: Revenues generated with polypropylene in Vietnam from 2018 to 2030 in million USD – split by applications
Table 215: Production, import, and export of and demand for polypropylene in Vietnam from 2018 to 2030
Table 216: Revenues generated with polypropylene in the remaining countries of Asia-Pacific from 2018 to 2030 in million USD and million EUR
Table 217: Demand for polypropylene in Other Asia-Pacific from 2018 to 2030 – split by applications
Table 218: Demand for polypropylene in Other Asia-Pacific from 2018 to 2030 – split by products
Table 219: Demand for polypropylene in Other Asia-Pacific from 2018 to 2030 – split by technologies
Table 220: Revenues generated with polypropylene in the remaining Asian-Pacific countries from 2018 to 2030 in billion USD – split by applications
Table 221: Production, import, and export of and demand for polypropylene in the remaining countries of Asia-Pacific from 2018 to 2030
Table 222: Revenues generated with polypropylene in Iran from 2018 to 2030 in million USD and million EUR
Table 223: Demand for polypropylene in Iran from 2018 to 2030 – split by applications
Table 224: Demand for polypropylene in Iran from 2018 to 2030 – split by products
Table 225: Demand for polypropylene in Iran from 2018 to 2030 – split by technologies
Table 226: Revenues generated with polypropylene in Iran from 2018 to 2030 in million USD – split by applications
Table 227: Production, import, and export of and demand for polypropylene in Iran from 2018 to 2030
Table 228: Revenues generated with polypropylene in Saudi Arabia from 2018 to 2030 in million USD and million EUR
Table 229: Demand for polypropylene in Saudi Arabia from 2018 to 2030– split by applications
Table 230: Demand for polypropylene in Saudi Arabia from 2018 to 2030– split by products
Table 231: Demand for polypropylene in Saudi Arabia from 2018 to 2030– split by technologies
Table 232: Revenues generated with polypropylene in Saudi Arabia from 2018 to 2030 in million USD – split by applications
Table 233: Production, import, and export of and demand for polypropylene in Saudi Arabia from 2018 to 2030
Table 234: Revenues generated with polypropylene in the remaining countries in the Middle East from 2018 to 2030 in million USD and million EUR
Table 235: Demand for polypropylene in Other Middle East from 2018 to 2030 – split by applications
Table 236: Demand for polypropylene in Other Middle East from 2018 to 2030 – split by products
Table 237: Demand for polypropylene in Other Middle East from 2018 to 2030 – split by technologies
Table 238: Revenues generated with polypropylene in other Middle Eastern countries from 2018 to 2030 in billion USD – split by applications
Table 239: Production, import, and export of and demand for polypropylene in the remaining countries in the Middle East from 2018 to 2030
Table 240: Revenues generated with polypropylene in Egypt from 2018 to 2030 in million USD and million EUR
Table 241: Demand for polypropylene in Egypt from 2018 to 2030 – split by applications
Table 242: Demand for polypropylene in Egypt from 2018 to 2030 – split by products
Table 243: Demand for polypropylene in Egypt from 2018 to 2030 – split by technologies
Table 244: Revenues generated with polypropylene in Egypt from 2018 to 2030 in million USD – split by applications
Table 245: Production, import, and export of and demand for polypropylene in Egypt from 2018 to 2030
Table 246: Revenues generated with polypropylene in South Africa from 2018 to 2030 in million USD and million EUR
Table 247: Demand for polypropylene in South Africa from 2018 to 2030 – split by applications
Table 248: Demand for polypropylene in South Africa from 2018 to 2030 – split by products
Table 249: Demand for polypropylene in South Africa from 2018 to 2030 – split by technologies
Table 250: Revenues generated with polypropylene in South Africa from 2018 to 2030 in million USD – split by applications
Table 251: Production, import, and export of and demand for polypropylene in South Africa from 2018 to 2030
Table 252: Revenues generated with polypropylene in the remaining African countries from 2018 to 2030 in million USD and million EUR
Table 253: Demand for polypropylene in Other Africa from 2018 to 2030 – split by applications
Table 254: Demand for polypropylene in Other Africa from 2018 to 2030– split by products
Table 255: Demand for polypropylene in Other Africa from 2018 to 2030– split by technologies
Table 256: Revenues generated with polypropylene in other African countries from 2018 to 2030 in million USD – split by applications
Table 257: Production, import, and export of and demand for polypropylene in the remaining African countries from 2018 to 2030


