

Description
The Expandable Polystyrene (EPS) Market Report is now also available in parts (e.g. individual country profiles or all manufacturer profiles). Please feel free to contact us and we will immediately send you an offer for your specific selection.
Rising energy costs are fueling the market for insulation materials, despite a weakening construction industry. This is hardly surprising, since the energy savings made possible by thermal insulation exceed the cost many times over. In Germany, for example, an uninsulated house wall loses the equivalent of around 158 liters of heating oil per square meter within 20 years – whereas a very well insulated wall loses only 20 liters. Ceresana has investigated the world market for the best-selling insulation material: EPS foam. Traded under brand names such as Styropor or Airpop, it is the most widely used insulation material in the world. According to the latest, and already fifth, edition of the “Expanded Polystyrene” market report, a total of around 7.2 million tonnes of EPS were consumed worldwide in 2022 – half a million tonnes more than five years ago.
EPS Renews the European Union
In Europe, real estate is still responsible for more than one third of final energy consumption and greenhouse gas emissions. Better building insulation is therefore a key objective of the “European Green Deal”. In 2020, the EU Commission published the Renovation Wave Strategy: by 2030, EU states are to invest around EUR 200 billion a year in the energy modernization of homes and public buildings. Despite Brexit, the United Kingdom is also aligning itself with the European Energy Performance of Buildings Directive. Manufacturers and processors of expandable polystyrene are benefiting particularly from these initiatives. So far, however, efforts have varied from region to region: in Italy, the EU targets would not be reached for another 3,800 years at the current rate of renovation.
Insulation and Packaging as Main Applications
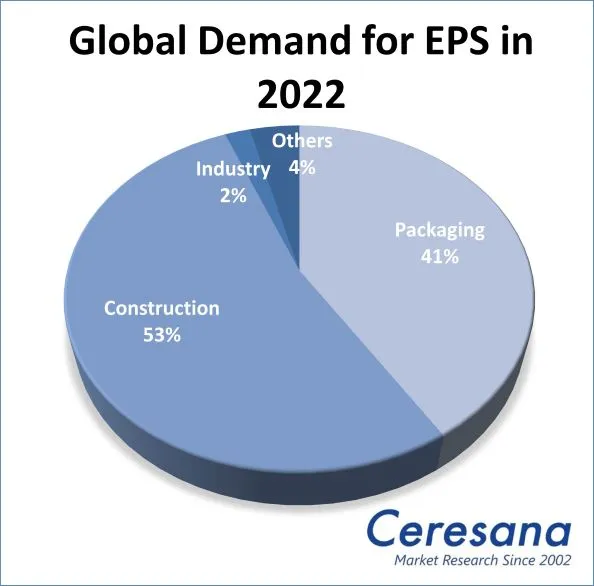
EPS is a light, strong foam that can be shaped almost at will. The versatile material consists mainly of air and the foamed plastic polystyrene, plus flame retardants and other additives, for example graphite. Construction products are the main application for EPS, accounting for around 53% of global demand. The construction industry uses the low-cost insulation material primarily to provide heat, cold and sound insulation for both new housing and the renovation of old buildings. Alternatives to EPS are glass and rock wool, and increasingly also insulation materials based on renewable raw materials. In Asia-Pacific and the Americas in particular, EPS is used not only for insulation purposes but also on a large scale for packaging, for example for beverage cups, fish boxes or the transport of electronic products. Worldwide, packaging accounts for over 41% of EPS demand. Especially in emerging and developing countries, the per capita demand for EPS packaging is increasing. Asia-Pacific accounts for the highest overall EPS demand, with around 57% of global EPS consumption in 2022.
The Study “Expandable Polystyrene – EPS” in Short:
Chapter 1 looks at the world market for expandable polystyrene: EPS production and consumption volumes as well as imports, exports and the revenue generated are given for the regions of Western Europe, Eastern Europe, North America, South America, Asia-Pacific, the Middle East and Africa. Forecasts up to the year 2032 are provided for this purpose.
Chapter 2 analyzes the EPS market data of the 25 most important countries, i.e. country-specific production and demand volumes, import and export figures, and revenue levels. The demand for EPS is also broken down for the various application areas: packaging, construction, industry and other applications.
Chapter 3 is a useful directory: Company profiles of the most significant EPS manufacturers are given. They are clearly arranged according to contact details, revenue, profit, product range, production facilities, production capacities and short profile. Detailed profiles are provided by 43 manufacturers, such as Alpek, BASF, Flint Hills, Loyal, Ming Dih, Nova Chemicals, SIBUR, Sunpor, SPL, Synthos, and Wuxi Xingda.
Scope of the Report:
Attributes | Details |
| Base Year | 2022 |
| Trend Period | 2020 – 2032 |
| Forecast Period | 2023 – 2032 |
| Pages | 240 |
| Application Areas | Packaging, Construction, Industry, Other Applications |
| Company Profiles | Alpek, BASF, Flint Hills, Loyal, Ming Dih, Nova Chemicals, SIBUR, Sunpor, SPL, Synthos, and Wuxi Xingda (Selection) |
| Edition | 5th edition |
| Publication | February 2023 |
FAQs
What was the consumption of EPS in 2022?
A total of around 7.2 million tonnes of EPS was consumed worldwide in 2022.
Which market accounts for the largest share of EPS consumption?
The market for construction products accounts for around 53% of EPS consumption.
Which region had the highest market share in 2022?
Asia-Pacific accounts for the highest overall EPS demand, with around 57% of global EPS consumption in 2022.
1 Market Data: World and Regions
1.1 World
1.1.1 Demand
1.1.2 Revenues
1.1.3 Production
1.1.4 Demand Split by Application Areas
1.2 Western Europe
1.2.1 Demand
1.2.2 Revenues
1.2.3 Production
1.2.4 Applications
1.3 Eastern Europe
1.3.1 Demand
1.3.2 Revenues
1.3.3 Production
1.3.4 Applications
1.4 North America
1.4.1 Demand
1.4.2 Revenues
1.4.3 Production
1.4.4 Applications
1.5 South America
1.5.1 Demand
1.5.2 Revenues
1.5.3 Production
1.5.4 Applications
1.6 Asia-Pacific
1.6.1 Demand
1.6.2 Revenues
1.6.3 Production
1.6.4 Applications
1.7 Middle East
1.7.1 Demand
1.7.2 Revenues
1.7.3 Production
1.7.4 Applications
1.8 Africa
1.8.1 Demand
1.8.2 Revenues
1.8.3 Applications
2 Market Data: Countries
2.1 Western Europe
2.1.1 France
2.1.2 Germany
2.1.3 Italy
2.1.4 Spain
2.1.5 The Netherlands
2.1.6 United Kingdom
2.1.7 Other Western Europe
2.2 Eastern Europe
2.2.1 Poland
2.2.2 Russia
2.2.3 Turkey
2.2.4 Other Eastern Europe
2.3 North America
2.3.1 Canada
2.3.2 Mexico
2.3.3 USA
2.4 South America
2.4.1 Argentina
2.4.2 Brazil
2.4.3 Other South America
2.5 Asia-Pacific
2.5.1 China
2.5.2 India
2.5.3 Japan
2.5.4 Malaysia
2.5.5 South Korea
2.5.6 Taiwan
2.5.7 Thailand
2.5.8 Other Asia-Pacific
2.6 Middle East
2.6.1 Iran
2.6.2 Saudi Arabia
2.6.3 Other Middle East
2.7 Africa
2.7.1 Egypt
2.7.2 South Africa
2.7.3 Other Africa
3 Company Profiles
3.1 Western Europe
Austria (1 Producer )
Belgium (1)
France (1)
Germany (1)
Italy (1)
Luxembourg (1)
Norway (1)
Sweden (1)
The Netherlands (1)
3.2 Eastern Europe
Poland (1)
Russia (1)
Turkey (2)
Ukraine (1)
3.3 North America
Canada (1)
Mexico (2)
USA (2)
3.4 South America
Brazil (2)
3.5 Asia-Pacific
China (7)
India (1)
Japan (3)
South Korea (4)
Taiwan (2)
Thailand (1)
Vietnam (1)
3.6 Middle East
Iran (1)
Pakistan (1)
Saudi Arabia (1)
*Note: The profiles are assigned to the country in which the company or holding is headquartered. Profiles also include JVs and subsidiaries.
Graph 1: Global demand from 2020 to 2032
Graph 2: Global demand from 2020 to 2032 – split by region
Graph 3: Global revenues from 2020 to 2032 in billion USD and billion EUR
Graph 4: Global revenues from 2020 to 2032 in billion USD – split by region
Graph 5: Global revenues from 2020 to 2032 in billion EUR – split by region
Graph 6: Global production from 2020 to 2032
Graph 7: Global production from 2020 to 2032 – split by region
Graph 8: Global demand from 2020 to 2032 – split by application
Graph 9: Global demand for EPS in packaging from 2020 to 2032 – split by region
Graph 10: Global demand for EPS in construction from 2020 to 2032 – split by region
Graph 11: Global demand for EPS in the industry sub-market from 2020 to 2032 – split by region
Graph 12: Global demand for EPS in other applications from 2020 to 2032 – split by region
Graph 13: Demand in Western Europe from 2020 to 2032
Graph 14: Revenues generated in Western Europe from 2020 to 2032 in billion USD and billion EUR
Graph 15: Production in Western Europe from 2020 to 2032
Graph 16: Demand in Western Europe from 2020 to 2032 – split by application
Graph 17: Demand in Eastern Europe from 2020 to 2032
Graph 18: Revenues in Eastern Europe from 2020 to 2032, in billion USD and billion EUR
Graph 19: Production in Eastern Europe from 2020 to 2032
Graph 20: Demand in Eastern Europe from 2020 to 2032 – split by application
Graph 21: Demand in North America from 2020 to 2032
Graph 22: Revenues generated in North America from 2020 to 2032, in billion USD and billion EUR
Graph 23: Production in North America from 2020 to 2032
Graph 24: Demand in North America from 2020 to 2032 – split by application
Graph 25: Demand in South America from 2020 to 2032
Graph 26: Revenues in South America from 2020 to 2032, in billion USD and billion EUR
Graph 27: Production in South America from 2020 to 2032
Graph 28: Demand in South America from 2020 to 2032 – split by application
Graph 29: Demand in Asia-Pacific from 2020 to 2032
Graph 30: Revenues generated in Asia-Pacific from 2020 to 2032, in billion USD and billion EUR
Graph 31: Production in Asia-Pacific from 2020 to 2032
Graph 32: Demand in Asia-Pacific from 2020 to 2032 – split by application
Graph 33: Demand in the Middle East from 2020 to 2032
Graph 34: Revenues in the Middle East from 2020 to 2032, in billion USD and billion EUR
Graph 35: Production in the Middle East from 2020 to 2032
Graph 36: Demand in the Middle East from 2020 to 2032 – split by application
Graph 37: Demand in Africa from 2020 to 2032
Graph 38: Revenues in Africa from 2020 to 2032, in billion USD and billion EUR
Graph 39: Demand in Africa from 2020 to 2032 – split by application
Graph 40: Demand in France from 2020 to 2032
Graph 41: Production in France from 2020 to 2032
Graph 42: Demand in Germany from 2020 to 2032
Graph 43: Production in Germany from 2020 to 2032
Graph 44: Demand in Italy from 2020 to 2032
Graph 45: Production in Italy from 2020 to 2032
Graph 46: Demand in Spain from 2020 to 2032
Graph 47: Demand in the Netherlands from 2020 to 2032
Graph 48: Production in the Netherlands from 2020 to 2032
Graph 49: Demand in the United Kingdom from 2020 to 2032
Graph 50: Demand in Other Western Europe from 2020 to 2032
Graph 51: Production in Other Western Europe from 2020 to 2032
Graph 52: Demand in Poland from 2020 to 2032
Graph 53: Production in Poland from 2020 to 2032
Graph 54: Demand in Russia from 2020 to 2032
Graph 55: Production in Russia from 2020 to 2032
Graph 56: Demand in Turkey from 2020 to 2032
Graph 57: Production in Turkey from 2020 to 2032
Graph 58: Demand in Other Eastern Europe from 2020 to 2032
Graph 59: Production in Other Eastern Europe from 2020 to 2032
Graph 60: Demand in Canada from 2020 to 2032
Graph 61: Production in Canada from 2020 to 2032
Graph 62: Demand in Mexico from 2020 to 2032
Graph 63: Production in Mexico from 2020 to 2032
Graph 64: Demand in the USA from 2020 to 2032
Graph 65: Production in the USA from 2020 to 2032
Graph 66: Demand in Argentina from 2020 to 2032
Graph 67: Production in Argentina from 2020 to 2032
Graph 68: Demand in Brazil from 2020 to 2032
Graph 69: Production in Brazil from 2020 to 2032
Graph 70: Demand in Other South America from 2020 to 2032
Graph 71: Production in Other South America from 2020 to 2032
Graph 72: Demand in China from 2020 to 2032
Graph 73: Production in China from 2020 to 2032
Graph 74: Demand in India from 2020 to 2032
Graph 75: Production in India from 2020 to 2032
Graph 76: Demand in Japan from 2020 to 2032
Graph 77: Production in Japan from 2020 to 2032
Graph 78: Demand in Malaysia from 2020 to 2032
Graph 79: Demand in South Korea from 2020 to 2032
Graph 80: Production in South Korea from 2020 to 2032
Graph 81: Demand in Taiwan from 2020 to 2032
Graph 82: Production in Taiwan from 2020 to 2032
Graph 83: Demand in Thailand from 2020 to 2032
Graph 84: Production in Thailand from 2020 to 2032
Graph 85: Demand in the remaining countries of Asia-Pacific from 2020 to 2032
Graph 86: Production in Other Asia-Pacific from 2020 to 2032
Graph 87: Demand in Iran from 2020 to 2032
Graph 88: Production in Iran from 2020 to 2032
Graph 89: Demand in Saudi Arabia from 2020 to 2032
Graph 90: Production in Saudi Arabia from 2020 to 2032
Graph 91: Demand in Other Middle East from 2020 to 2032
Graph 92: Production in Other Middle East from 2020 to 2032
Graph 93: Demand in Egypt from 2020 to 2032
Graph 94: Demand in South Africa from 2020 to 2032
Graph 95: Demand in Other Africa from 2020 to 2032
Table 1: Global demand from 2020 to 2032 – split by region
Table 2: Global revenues from 2020 to 2032 in million USD – split by region
Table 3: Global revenues from 2020 to 2032 in million EUR – split by region
Table 4: Global production from 2020 to 2032 – split by region
Table 5: Global demand from 2020 to 2032 – split by application
Table 6: Global demand for EPS in packaging from 2020 to 2032 – split by region
Table 7: Global demand for EPS in construction from 2020 to 2032 – split by region
Table 8: Global demand for EPS in the industry sub-market from 2020 to 2032 – split by region
Table 9: Global demand for EPS in other applications from 2020 to 2032 – split by region
Table 10: Demand in Western Europe from 2020 to 2032 – split by major country
Table 11: Revenues generated in Western Europe from 2020 to 2032 in million USD and million EUR
Table 12: Production in Western Europe from 2020 to 2032 – split by major country
Table 13: Demand in Western Europe from 2020 to 2032 – split by application
Table 14: Demand in Eastern Europe from 2020 to 2032 – split by major country
Table 15: Revenues in Eastern Europe from 2020 to 2032 in million USD and million EUR
Table 16: Production in Eastern Europe from 2020 to 2032 – split by major country
Table 17: Demand in Eastern Europe from 2020 to 2032 – split by application
Table 18: Demand in North America from 2020 to 2032 – split by major country
Table 19: Revenues generated in North America from 2020 to 2032 in million USD and million EUR
Table 20: Production in North America from 2020 to 2032 – split by major country
Table 21: Demand in North America from 2020 to 2032 – split by application
Table 22: Demand in South America from 2020 to 2032 – split by major country
Table 23: Revenues in South America from 2020 to 2032 in million USD and million EUR
Table 24: Production in South America from 2020 to 2032 – split by major country
Table 25: Demand in South America from 2020 to 2032 – split by application
Table 26: Demand in Asia-Pacific from 2020 to 2032 – split by major country
Table 27: Revenues generated in Asia-Pacific from 2020 to 2032 in million USD and million EUR
Table 28: Production in Asia-Pacific from 2020 to 2032 – split by major country
Table 29: Demand in Asia-Pacific from 2020 to 2032 – split by application
Table 30: Demand in the Middle East from 2020 to 2032 – split by major country
Table 31: Revenues in the Middle East from 2020 to 2032 in million USD and million EUR
Table 32: Production in the Middle East from 2020 to 2032 – split by major country
Table 33: Demand in the Middle East from 2020 to 2032 – split by application
Table 34: Demand in Africa from 2022 to 2032 – split by major country
Table 35: Revenues in Africa from 2020 to 2032, in million USD and million EUR
Table 36: Demand in Africa from 2020 to 2032 – split by application
Table 37: Revenues generated in France from 2020 to 2032 in million USD and million EUR
Table 38: Demand in France from 2020 to 2032 – split by application
Table 39: Production, import, export and demand in France from 2020 to 2032
Table 40: Revenues in Germany from 2020 to 2032 in million USD and million EUR
Table 41: Demand in Germany from 2020 to 2032 – split by application
Table 42: Production, import, export and demand in Germany from 2020 to 2032
Table 43: Revenues generated in Italy from 2020 to 2032 in million USD and million EUR
Table 44: Demand in Italy from 2020 to 2032 – split by application
Table 45: Production, import, export and demand in Italy from 2020 to 2032
Table 46: Revenues in Spain from 2020 to 2032 in million USD and million EUR
Table 47: Demand in Spain from 2020 to 2032 – split by application
Table 48: Revenues generated in the Netherlands from 2020 to 2032 in million USD and million EUR
Table 49: Demand in the Netherlands from 2020 to 2032 – split by application
Table 50: Production, import, export and demand in the Netherlands from 2020 to 2032
Table 51: Revenues in the United Kingdom from 2020 to 2032 in million USD and million EUR
Table 52: Demand in the United Kingdom from 2020 to 2032 – split by application
Table 53: Revenues in Other Western Europe from 2020 to 2032 in million USD and million EUR
Table 54: Demand in Other Western Europe from 2020 to 2032 – split by application
Table 55: Production, import, export and demand in the remaining countries of Western Europe from 2020 to 2032
Table 56: Revenues generated in Poland from 2020 to 2032 in million USD and million EUR
Table 57: Demand in Poland from 2020 to 2032 – split by application
Table 58: Production, import, export and demand in Poland from 2020 to 2032
Table 59: Revenues generated in Russia from 2020 to 2032 in million USD and million EUR
Table 60: Demand in Russia from 2020 to 2032 – split by application
Table 61: Production, import, export and demand in Russia from 2020 to 2032
Table 62: Revenues generated in Turkey from 2020 to 2032 in million USD and million EUR
Table 63: Demand in Turkey from 2020 to 2032 – split by application
Table 64: Production, import, export and demand in Turkey from 2020 to 2032
Table 65: Revenues in Other Eastern Europe from 2020 to 2032 in billion USD and billion EUR
Table 66: Demand in Other Eastern Europe from 2020 to 2032 – split by application
Table 67: Production, import, export and demand in the remaining countries of Eastern Europe from 2020 to 2032
Table 68: Revenues in Canada from 2020 to 2032, in million USD and million EUR
Table 69: Demand in Canada from 2020 to 2032 – split by application
Table 70: Production, import, export and demand in Canada from 2020 to 2032
Table 71: Revenues in Mexico from 2020 to 2032 in million USD and million EUR
Table 72: Demand in Mexico from 2020 to 2032 – split by application
Table 73: Production, import, export and demand in Mexico from 2020 to 2032
Table 74: Revenues generated in the USA from 2020 to 2032 in million USD and million EUR
Table 75: Demand in the USA from 2020 to 2032 – split by application
Table 76: Production, import, export and demand in the USA from 2020 to 2032
Table 77: Revenues generated in Argentina from 2020 to 2032, in million USD and million EUR
Table 78: Demand in Argentina from 2020 to 2032 – split by application
Table 79: Production, import, export and demand in Argentina from 2020 to 2032
Table 80: Revenues generated in Brazil from 2020 to 2032 in million USD and million EUR
Table 81: Demand in Brazil from 2020 to 2032 – split by application
Table 82: Production, import, export and demand in Brazil from 2020 to 2032
Table 83: Revenues in Other South America from 2020 to 2032 in million USD and million EUR
Table 84: Demand in Other South America from 2020 to 2032 – split by application
Table 85: Production, import, export and demand in the remaining countries of South America from 2020 to 2032
Table 86: Revenues generated in China from 2020 to 2032 in million USD and million EUR
Table 87: Demand in China from 2020 to 2032 – split by application
Table 88: Production, import, export and demand in China from 2020 to 2032
Table 89: Revenues generated in India from 2020 to 2032 in million USD and million EUR
Table 90: Demand in India from 2020 to 2032 – split by application
Table 91: Production, import, export and demand in India from 2020 to 2032
Table 92: Revenues in Japan from 2020 to 2032, in million USD and million EUR
Table 93: Demand in Japan from 2020 to 2032 – split by application
Table 94: Production, import, export and demand in Japan from 2020 to 2032
Table 95: Revenues generated in Malaysia from 2020 to 2032, in million USD and million EUR
Table 96: Demand in Malaysia from 2020 to 2032 – split by application
Table 97: Revenues generated in South Korea from 2020 to 2032 in million USD and million EUR
Table 98: Demand in South Korea from 2020 to 2032 – split by application
Table 99: Production, import, export and demand in South Korea from 2020 to 2032
Table 100: Revenues generated in Taiwan from 2020 to 2032 in million USD and million EUR
Table 101: Demand in Taiwan from 2020 to 2032 – split by application
Table 102: Production, import, export and demand in Taiwan from 2020 to 2032
Table 103: Revenues generated in Thailand from 2020 to 2032, in million USD and million EUR
Table 104: Demand in Thailand from 2020 to 2032 – split by application
Table 105: Production, import, export and demand in Thailand from 2020 to 2032
Table 106: Revenues in the remaining countries of Asia-Pacific from 2020 to 2032 in million USD and million EUR
Table 107: Demand in Other Asia-Pacific from 2020 to 2032 – split by application
Table 108: Production, import, export and demand in the remaining countries of Asia-Pacific from 2020 to 2032
Table 109: Revenues generated in Iran from 2020 to 2032 in million USD and million EUR
Table 110: Demand in Iran from 2020 to 2032 – split by application
Table 111: Production, import, export and demand in Iran from 2020 to 2032
Table 112: Revenues generated in Saudi Arabia from 2020 to 2032 in million USD and million EUR
Table 113: Demand in Saudi Arabia from 2020 to 2032 – split by application
Table 114: Production, import, export and demand in Saudi Arabia from 2020 to 2032
Table 115: Revenues generated in the remaining countries of the Middle East from 2020 to 2032 in million USD and million EUR
Table 116: Demand in Other Middle East from 2020 to 2032 – split by application
Table 117: Production, import, export and demand in the remaining countries in the Middle East from 2020 to 2032
Table 118: Revenues generated in Egypt from 2020 to 2032, in million USD and million EUR
Table 119: Demand in Egypt from 2020 to 2032 – split by application
Table 120: Revenues generated in South Africa from 2020 to 2032 in million USD and million EUR
Table 121: Demand in South Africa from 2020 to 2032 – split by application
Table 122: Revenues in Other Africa from 2020 to 2032 in million USD and million EUR
Table 123: Demand in Other Africa from 2020 to 2032 – split by application


