

Description
The Plastic Caps and Closures Market Report – World is now also available in parts (e.g. individual country profiles or all manufacturer profiles). Please feel free to contact us and we will immediately send you an offer for your specific selection.
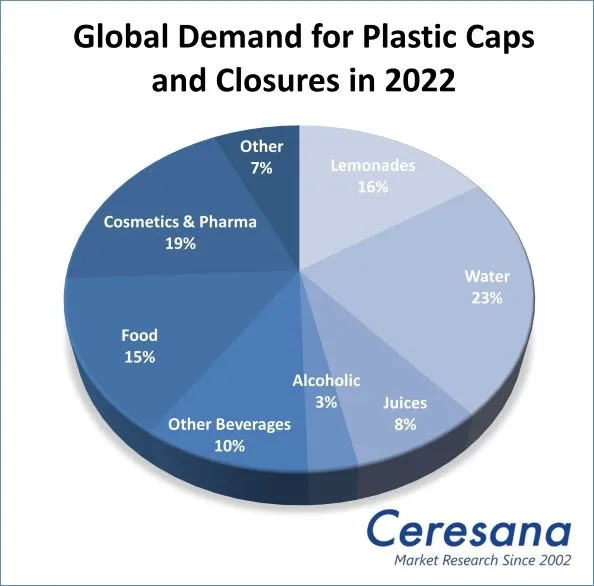
Stay hydrated! Demand for sugary sodas, carbonated soft drinks and juices is hardly growing at all. In contrast, sales of bottled water have increased once again since Corona, probably for hygiene reasons. The trend towards a healthier lifestyle, promoted by many countries, is clearly reflected in the latest edition of Ceresana’s market study “Plastic Closures – World”. In general, more and more packaging made of plastics is needed for food. As a result, demand is also growing for different types of plastic closures, i.e., screw caps, flip-top lids, disc-top closures, dispensers, sprays, lids and caps. Ceresana forecasts that sales of plastic closures – in terms of units – will increase by around 2.9% per year until 2032.
Higher-Quality Closures Gain Market Share
Processors of plastics are trying to get by with less and less material. Last year, simple screw caps still accounted for around two-thirds of the global market for plastic closures. However, the market researchers at Ceresana are registering a trend towards more elaborate closures, particularly for premium products such as perfumes or pharmaceuticals. Manufacturers and sellers of packaging for cosmetic and pharmaceutical products are benefiting from social developments: More and more women are working outside the home, healthcare is starting to improve in poorer countries, and in already industrialized regions demographic change is causing an increase in the consumption of medication. The growth of convenience and on-the-go products is increasing demand for resealable packaging, especially in the food sector.
Polypropylene and Polyethylene Ahead of PET
Practical and lightweight stand-up pouches for liquids, viscous substances, creams and other applications are increasingly being manufactured with an integrated and closable spout. Due to the smaller size of these closures, manufacturers must meet different requirements for these flexible packages than for traditional screw closures. The different demands for and designs of the closure types have an impact on the choice of plastics used in each case. Ceresana’s new study provides separate figures on the global closure market for the plastic types polypropylene (PP), polyethylene (HDPE and LDPE), polyethylene terephthalate (PET), polystyrene (PS) and the “other plastics” aggregate. There are clear regional and country-specific differences.
The Current Ceresana Market Study “Plastic Closures – World”:
Chapter 1 analyzes global market for plastic closures. Each analysis is broken down by region and displays its relative production and demand figures in Billion Units. Global demand for plastic closures is additionally divided up into the various plastic grade polypropylene (PP), polyethylene (HDPE and LDPE), polyethylene terephthalate (PET), polystyrene (PS) and the aggregate “other plastics”. This includes forecasts up to the year 2032.
In Chapter 2, production, import, export of, and demand for plastic closures are given in Billions Units for the leading 19 countries. In addition, the demand for plastic closures is broken down for each country both by application and closure type.
Applications:
- Lemonades
- Water
- Fruit Juices
- Alcoholic Beverages
- Other Beverages
- Food
- Cosmetics & Pharma
- Other Applications, for example household or industrial chemicals
Types of Closures:
- Screw Caps
- Flip-Top and Disc-Top-Closures
- Dispensers and Sprays
- Lids and Overcaps
Chapter 3 provides useful company profiles of the top producers of plastic closures categorized by contact details, revenues, profit, product range, production sites and brief profile. These detailed profiles are comprised of 65 manufacturers, such as ALPLA Werke Alwin Lehner GmbH & Co KG, Amcor Ltd., Berry Global Group, Inc., Silgan Holdings Inc, Sonoco Products Co., Ltd., Tetra Laval Group, and Toyo Seikan Co., Ltd.
Scope of the Report:
Attributes | Details |
| Base Year | 2022 |
| Trend Period | 2020 – 2032 |
| Forecast Period | 2023 – 2032 |
| Pages | 260 |
| Application Areas | Lemonades, Water, Juices, Alcoholic Beverages, Other Beverages, Food, Cosmetics & Pharma, Other Applications |
| Closure Types | Screw Caps, Flip-Top and Disc-Top Caps, Dispensers and Sprays, Lids and Overcaps |
| Company Profiles | ALPLA Werke Alwin Lehner GmbH & Co KG, Amcor Ltd., Berry Global Group, Inc., Silgan Holdings Inc, Sonoco Products Co., Ltd., Tetra Laval Group, and Toyo Seikan Co., Ltd. (Selection) |
| Edition | 3rd edition |
| Publication | February 2023 |
FAQs
How will demand for plastic closures develop up until 2032?
Ceresana forecasts that sales of plastic closures – in terms of units – will increase by around 2.9% per year until 2032.
Which closure type was used most frequently in 2022?
Last year, simple screw caps accounted for around two-thirds of the global market for plastic closures.
1 Market Data: World and Regions
1.1 World
1.1.1 Demand
1.1.2 Production
1.1.3 Demand Split by Application Area
1.1.4 Demand Split by Closure Type
1.1.5 Demand Split by Plastic Type (PP, PE, PET, PS, Others)
1.2 Western Europe
1.2.1 Demand
1.2.2 Production
1.2.3 Applications and Closure Types
1.3 Eastern Europe
1.3.1 Demand
1.3.2 Production
1.3.3 Applications and Closure Types
1.4 North America
1.4.1 Demand
1.4.2 Production
1.4.3 Applications and Closure Types
1.5 South America
1.5.1 Demand
1.5.2 Production
1.5.3 Applications and Closure Types
1.6 Asia-Pacific
1.6.1 Demand
1.6.2 Production
1.6.3 Applications and Closure Types
1.7 Middle East and Africa
1.7.1 Demand
1.7.2 Production
1.7.3 Applications and Closure Types
2 Market Data: Countries
2.1 Western Europe
2.1.1 France
2.1.2 Germany
2.1.3 Italy
2.1.4 Spain
2.1.5 United Kingdom
2.1.6 Other Western Europe
2.2 Eastern Europe
2.2.1 Poland
2.2.2 Russia
2.2.3 Turkey
2.2.4 Other Eastern Europe
2.3 North America
2.3.1 Canada
2.3.2 Mexico
2.3.3 USA
2.4 South America
2.4.1 Argentina
2.4.2 Brazil
2.4.3 Other South America
2.5 Asia-Pacific
2.5.1 China
2.5.2 India
2.5.3 Indonesia
2.5.4 Japan
2.5.5 South Korea
2.5.6 Thailand
2.5.7 Other Asia-Pacific
3 Company Profiles
3.1 Western Europe
Austria (3 Producer)
Belgium (1)
Finland (1)
France (3)
Germany (10)
Ireland (1)
Italy (4)
Luxembourg (1)
Norway (1)
Portugal (1)
Spain (1)
Sweden (2)
Switzerland (6)
The Netherlands (1)
3.2 Eastern Europe
Russia (1)
Turkey (1)
3.3 North America
Canada (1)
USA (14)
3.4 South America
Brazil (1)
3.5 Asia-Pacific
Australia (1)
China (3)
India (2)
Japan (3)
Taiwan (1)
South Africa (1)
*Note: The profiles are assigned to the country in which the company or holding is headquartered. Profiles also include JVs and subsidiaries.
Graph 1: Global demand from 2020 to 2032
Graph 2: Global demand from 2020 to 2032 – split by region
Graph 3: Global production from 2020 to 2032
Graph 4: Global production from 2020 to 2032 – split by region
Graph 5: Global demand for plastic caps and closures in the application area “lemonades” from 2020 to 2032 – split by region
Graph 6: Global demand for plastic caps and closures in the application area “water” from 2020 to 2032 – split by region
Graph 7: Global demand for plastic caps and closures in the application area “fruit juices” from 2020 to 2032 – split by region
Graph 8: Global demand for plastic caps and closures in the application area “alcoholic beverages” from 2020 to 2032 – split by region
Graph 9: Global demand for plastic caps and closures in the application area “other beverages” from 2020 to 2032 – split by region
Graph 10: Global demand for plastic caps and closures in the application area “food” from 2020 to 2032 – split by region
Graph 11: Global demand for plastic caps and closures in the application area “cosmetics and pharma” from 2020 to 2032 – split by region
Graph 12: Global demand for plastic caps and closures in other applications from 2020 to 2032 – split by region
Graph 13: Global demand for screw caps from 2020 to 2032 – split by region
Graph 14: Global demand for flip-top and disc-top closures from 2020 to 2032 – split by region
Graph 15: Global demand for dispensers and spray closures from 2020 to 2032 – split by region
Graph 16: Global demand for lids and overcaps from 2020 to 2032 – split by region
Graph 17: Global demand from 2020 to 2032
Graph 18: Demand in Western Europe from 2020 to 2032
Graph 19: Production in Western Europe from 2020 to 2032
Graph 20: Demand in Eastern Europe from 2020 to 2032
Graph 21: Production in Eastern Europe from 2020 to 2032
Graph 22: Demand in North America from 2020 to 2032
Graph 23: Production in North America from 2020 to 2032
Graph 24: Demand in South America from 2020 to 2032
Graph 25: Production in South America from 2020 to 2032
Graph 26: Demand in Asia-Pacific from 2020 to 2032
Graph 27: Production in Asia-Pacific from 2020 to 2032
Graph 28: Demand in the Middle East and Africa from 2020 to 2032
Graph 29: Production in the Middle East and Africa from 2020 to 2032
Graph 30: Demand in France from 2020 to 2032
Graph 31: Production in France from 2020 to 2032
Graph 32: Demand in Germany from 2020 to 2032
Graph 33: Production in Germany from 2020 to 2032
Graph 34: Demand in Italy from 2020 to 2032
Graph 35: Production in Italy from 2020 to 2032
Graph 36: Demand in Spain from 2020 to 2032
Graph 37: Production in Spain from 2020 to 2032
Graph 38: Demand in the United Kingdom from 2020 to 2032
Graph 39: Production in the United Kingdom from 2020 to 2032
Graph 40: Demand in Other Western Europe from 2020 to 2032
Graph 41: Production in Other Western Europe from 2020 to 2032
Graph 42: Demand in Poland from 2020 to 2032
Graph 43: Production in Poland from 2020 to 2032
Graph 44: Demand in Russia from 2020 to 2032
Graph 45: Production in Russia from 2020 to 2032
Graph 46: Demand in Turkey from 2020 to 2032
Graph 47: Production in Turkey from 2020 to 2032
Graph 48: Demand in Other Eastern Europe from 2020 to 2032
Graph 49: Production in Other Eastern Europe from 2020 to 2032
Graph 50: Demand in Canada from 2020 to 2032
Graph 51: Production in Canada from 2020 to 2032
Graph 52: Demand in Mexico from 2020 to 2032
Graph 53: Production in Mexico from 2020 to 2032
Graph 54: Demand in the USA from 2020 to 2032
Graph 55: Production in the USA from 2020 to 2032
Graph 56: Demand in Argentina from 2020 to 2032
Graph 57: Production in Argentina from 2020 to 2032
Graph 58: Demand in Brazil from 2020 to 2032
Graph 59: Production in Brazil from 2020 to 2032
Graph 60: Demand in Other South America from 2020 to 2032
Graph 61: Production in Other South America from 2020 to 2032
Graph 62: Demand in China from 2020 to 2032
Graph 63: Production in China from 2020 to 2032
Graph 64: Demand in India from 2020 to 2032
Graph 65: Production in India from 2020 to 2032
Graph 66: Demand in Indonesia from 2020 to 2032
Graph 67: Production in Indonesia from 2020 to 2032
Graph 68: Demand in Japan from 2020 to 2032
Graph 69: Production in Japan from 2020 to 2032
Graph 70: Demand in South Korea from 2020 to 2032
Graph 71: Production in South Korea from 2020 to 2032
Graph 72: Demand in Thailand from 2020 to 2032
Graph 73: Production in Thailand from 2020 to 2032
Graph 74: Demand in the remaining countries of Asia-Pacific from 2020 to 2032
Graph 75: Production in Other Asia-Pacific from 2020 to 2032
Table 1: Global demand from 2020 to 2032 – split by region
Table 2: Global production from 2020 to 2032 – split by region
Table 3: Global demand from 2020 to 2032 – split by application
Table 4: Global demand for plastic caps and closures in the application area “lemonades” from 2020 to 2032 – split by region
Table 5: Global demand for plastic caps and closures in the application area “water” from 2020 to 2032 – split by region
Table 6: Global demand for plastic caps and closures in the application area “fruit juices” from 2020 to 2032 – split by region
Table 7: Global demand for plastic caps and closures in the application area “alcoholic beverages” from 2020 to 2032 – split by region
Table 8: Global demand for plastic caps and closures in the application area “other beverages” from 2020 to 2032 – split by region
Table 9: Global demand for plastic caps and closures in the application area “food” from 2020 to 2032 – split by region
Table 10: Global demand for plastic caps and closures in the application area “cosmetics and pharma” from 2020 to 2032 – split by region
Table 11: Global demand for plastic caps and closures in other applications from 2020 to 2032 – split by region
Table 12: Global demand from 2020 to 2032 – split by closure type
Table 13: Global demand for screw caps from 2020 to 2032 – split by region
Table 14: Global demand for flip-top and disc-top closures from 2020 to 2032 – split by region
Table 15: Global demand for dispensers and spray closures from 2020 to 2032 – split by region
Table 16: Global demand for lids and overcaps from 2020 to 2032 – split by region
Table 17: Global demand from 2020 to 2032 – split by plastic type
Table 18: Demand in Western Europe from 2020 to 2032 – split by major country
Table 19: Production in Western Europe from 2020 to 2032 – split by major country
Table 20: Demand in Western Europe from 2020 to 2032 – split by application
Table 21: Demand in Western Europe from 2020 to 2032 – split by closure type
Table 22: Demand in Eastern Europe from 2020 to 2032 – split by major country
Table 23: Production in Eastern Europe from 2020 to 2032 – split by major country
Table 24: Demand in Eastern Europe from 2020 to 2032 – split by application
Table 25: Demand in Eastern Europe from 2020 to 2032 – split by closure type
Table 26: Demand in North America from 2020 to 2032 – split by major country
Table 27: Production in North America from 2020 to 2032 – split by major country
Table 28: Demand in North America from 2020 to 2032 – split by application
Table 29: Demand in North America from 2020 to 2032 – split by closure type
Table 30: Demand in South America from 2020 to 2032 – split by major country
Table 31: Production in South America from 2020 to 2032 – split by major country
Table 32: Demand in South America from 2020 to 2032 – split by application
Table 33: Demand in South America from 2020 to 2032 – split by closure type
Table 34: Demand in Asia-Pacific from 2020 to 2032 – split by major country
Table 35: Production in Asia-Pacific from 2020 to 2032 – split by major country
Table 36: Demand in Asia-Pacific from 2020 to 2032 – split by application
Table 37: Demand in Asia-Pacific from 2020 to 2032 – split by closure type
Table 38: Demand the Middle East and Africa from 2020 to 2032 – split by application
Table 39: Demand in the Middle East and Africa from 2020 to 2032 – split by closure type
Table 40: Demand in France from 2020 to 2032 – split by closure type
Table 41: Demand in France from 2020 to 2032 – split by application
Table 42: Production, import, export and demand in France from 2020 to 2032
Table 43: Demand in Germany from 2020 to 2032 – split by application
Table 44: Demand in Germany from 2020 to 2032 – split by application
Table 45: Production, import, export and demand in Germany from 2020 to 2032
Table 46: Demand in Italy from 2020 to 2032 – split by application
Table 47: Demand in Italy from 2020 to 2032 – split by closure type
Table 48: Production, import, export and demand in Italy from 2020 to 2032
Table 49: Demand in Spain from 2020 to 2032 – split by application
Table 50: Demand in Spain from 2020 to 2032 – split by closure type
Table 51: Production, import, export and demand in Spain from 2020 to 2032
Table 52: Demand in the United Kingdom from 2020 to 2032 – split by application
Table 53: Demand in the United Kingdom from 2020 to 2032 – split by closure type
Table 54: Production, import, export and demand in the United Kingdom from 2020 to 2032
Table 55: Demand in Other Western Europe from 2020 to 2032 – split by application
Table 56: Demand in Other Western Europe from 2020 to 2032 – split by closure type
Table 57: Production, import, export and demand in the remaining countries of Western Europe from 2020 to 2032
Table 58: Demand in Poland from 2020 to 2032 – split by application
Table 59: Demand in Poland from 2020 to 2032 – split by closure type
Table 60: Production, import, export and demand in Poland from 2020 to 2032
Table 61: Demand in Russia from 2020 to 2032 – split by application
Table 62: Demand in Russia from 2020 to 2032 – split by closure type
Table 63: Production, import, export and demand in Russia from 2020 to 2032
Table 64: Demand in Turkey from 2020 to 2032 – split by application
Table 65: Demand in Turkey from 2020 to 2032 – split by closure type
Table 66: Production, import, export and demand in Turkey from 2020 to 2032
Table 67: Demand in Other Eastern Europe from 2020 to 2032 – split by application
Table 68: Demand in Other Eastern Europe from 2020 to 2032 – split by closure type
Table 69: Production, import, export and demand in the remaining countries of Eastern Europe from 2020 to 2032
Table 70: Demand in Canada from 2020 to 2032 – split by application
Table 71: Demand in Canada from 2020 to 2032 – split by closure type
Table 72: Production, import, export and demand in Canada from 2020 to 2032
Table 73: Demand in Mexico from 2020 to 2032 – split by application
Table 74: Demand in Mexico from 2020 to 2032 – split by closure type
Table 75: Production, import, export and demand in Mexico from 2020 to 2032
Table 76: Demand in the USA from 2020 to 2032 – split by application
Table 77: Demand in the USA from 2020 to 2032 – split by closure type
Table 78: Production, import, export and demand in the USA from 2020 to 2032
Table 79: Demand in Argentina from 2020 to 2032 – split by application
Table 80: Demand in Argentina from 2020 to 2032 – split by closure type
Table 81: Production, import, export and demand in Argentina from 2020 to 2032
Table 82: Demand in Brazil from 2020 to 2032 – split by application
Table 83: Demand in Brazil from 2020 to 2032 – split by closure type
Table 84: Production, import, export and demand in Brazil from 2020 to 2032
Table 85: Demand in Other South America from 2020 to 2032 – split by application
Table 86: Demand in Other South America from 2020 to 2032 – split by closure type
Table 87: Production, import, export and demand in the remaining countries of South America from 2020 to 2032
Table 88: Demand in China from 2020 to 2032 – split by application
Table 89: Demand in China from 2020 to 2032 – split by closure type
Table 90: Production, import, export and demand in China from 2020 to 2032
Table 91: Demand in India from 2020 to 2032 – split by application
Table 92: Demand in India from 2020 to 2032 – split by closure types
Table 93: Production, import, export and demand in India from 2020 to 2032
Table 94: Demand in Indonesia from 2020 to 2032 – split by application
Table 95: Demand in Indonesia from 2020 to 2032 – split by closure type
Table 96: Production, import, export and demand in Indonesia from 2020 to 2032
Table 97: Demand in Japan from 2020 to 2032 – split by application
Table 98: Demand in Japan from 2020 to 2032 – split by closure type
Table 99: Production, import, export and demand in Japan from 2020 to 2032
Table 100: Demand in South Korea from 2020 to 2032 – split by application
Table 101: Demand in South Korea from 2020 to 2032 – split by closure type
Table 102: Production, import, export and demand in South Korea from 2020 to 2032
Table 103: Demand in Thailand from 2020 to 2032 – split by application
Table 104: Demand in Thailand from 2020 to 2032 – split by closure type
Table 105: Production, import, export and demand in Thailand from 2020 to 2032
Table 106: Demand in Other Asia-Pacific from 2020 to 2032 – split by application
Table 107: Demand in Other Asia-Pacific from 2020 to 2032 – split by closure type
Table 108: Production, import, export and demand in the remaining countries of Asia-Pacific from 2020 to 2032


