

Description
The Bags, Sacks, and Pouches Market Report – Europe is now also available in parts (e.g. individual country profiles or all manufacturer profiles). Please feel free to contact us and we will immediately send you an offer for your specific selection.
The circular economy and bio-economy are reaching everyday life: European Union regulations determine how heads of lettuce are wrapped and what packaging ends up in household garbage cans. Laws initiated by the EU’s “Green Deal” are starting to take effect: Ceresana’s latest market study shows that plastic carrier bags are increasingly being replaced by paper bags. At the same time, demand for garbage bags is rising because fewer and fewer carrier bags are finding a secondary use as garbage bags. For the fourth time, Ceresana has analyzed the entire European market for bags and sacks made of polyethylene film, films made from other plastics, woven plastic strips (woven bags) and paper. However, packaging made of cotton, jute or other materials is not covered in this study.
Wanted: Environmentally Friendly Bags
One of the European Union’s declared goals is to promote bioplastics to help reduce the demand for fossil raw materials and greenhouse gas emissions. The EU has announced new regulations on bio-based, biodegradable and compostable plastics, such as mandatory labeling, before the end of 2022. This should put an end to the “widespread confusion among consumers” and ensure that bioplastics lead to “genuine environmental benefits”. So far, plastic packaging made from renewable raw materials, such as corn starch or whey, is not necessarily compostable – whereas there are fossil-based plastic products that are biodegradable. Most European countries agree that single-use bags, which are mainly made of polyethylene, should disappear: Plastic carrier bags, such as the thin plastic shirt bags for fresh fruit and vegetables, are increasingly being subject to mandatory fees or banned altogether.
Winners and Losers Amid the Crisis
First the Corona pandemic, then political conflicts: the upswing in heavy-duty and industrial bags that has been observed for several years has come to a halt for the time being. The crises also hit their competition: the “Flexible Intermediate Bulk Containers” (FIBC), i.e., the flexible bulk containers made of stable plastic fabric, mostly polypropylene. The heavy-duty market is particularly dependent on the construction industry and demand for building materials. In this regard, Ceresana analysts expect that the 2019 level will not be reached again until 2025. The pouch packaging segment for food is expected to recover somewhat earlier. During the pandemic years 2020 and 2021, their demand had even increased, especially due to closed catering. However, this effect is now fading again: rapidly rising energy prices and inflation are now pressing issues – and many households have to save money.
The Study in Brief:
Chapter 1 provides an overview of the European market for bags, sacks and pouches, including forecasts up to 2031. Data regarding production and demand volumes as well as on the individual material types and application areas are presented in tables and figures.
Chapter 2 analyzes production (divided into plastics and paper), demand (broken down into polyethylene, other plastics, woven plastics and paper) as well as import and export (split into plastics and paper) for 23 individual countries. In addition, detailed information on the demand for bags, sacks and pouches is given for the eight most important markets in Europe (Germany, France, the United Kingdom, Italy, Poland, Russia, Spain, and Turkey), split by individual areas of application.
For these countries, the production of bags is further broken down by material:
The following applications are examined in detail:
Plastics:
- Carrier Bags
- Garbage Bags and Sacks
- Heavy Duty and Industry Sacks
- Food Packaging
- Frozen Food
- Ready Meals and Soups
- Confectionary
- Savory Snacks
- Baked Goods
- Fresh produce
- Pasta, Rice and other Food
- Other Applications
Paper:
- Carrier Bags
- Heavy Duty and Industry Sacks
- Food Packaging
- Baked Goods
- Fresh Produce
- Flour, Refined Sugar and other Food
- Other Applications (incl. Garbage Bags)
Chapter 3 provides useful company profiles of the most important producers of bags, sacks and pouches in Europe, clearly arranged according to contact details, revenues, profits, product range, production sites, brief profile as well as product types and application areas. Detailed profiles are provided by 76 manufacturers, such as Constantia Flexibles Group GmbH, Gascogne SA, Huhtamäki Oyi, Melitta Unternehmensgruppe Bentz KG, Mondi Group, RKW SE, Smurfit Kappa Group Plc, Stora Enso Oyj, Trioplast Industrier AB, VICAT SA, and Wihuri Group.
Scope of the Report:
Attributes | Details |
| Base Year | 2021 |
| Trend Period | 20122 – 2031 |
| Forecast Period | 2022 – 2031 |
| Pages | 300 |
| Materials | Polyethylene (LDPE, LLDPE, HDPE), Other Plastics, Woven Plastics, Paper |
| Applications – Plastic | Carrier Bags, Garbage Bags and Sacks, Heavy Duty and Industry Sacks, Food Packaging, Other Applications |
| Applications – Paper | Carrier Bags, Heavy Duty and Industry Sacks, Food Packaging, Other Applications (incl. Garbage Bags) |
| Company Profiles | Constantia, Gascogne SA, Huhtamäki, Melitta, Mondi, RKW, Smurfit, Stora Enso, Trioplast, VICAT, and Wihuri (Selection) |
| Edition | 4th edition |
| Publication | September 2022 |
FAQs
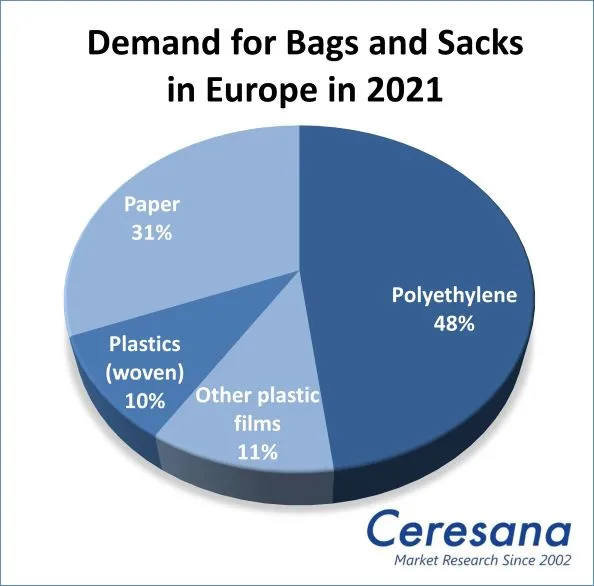
From which material are bags and sacks mainly made?
Polyethylene is by far the most widely used material in the production of bags, sacks and pouches, accounting for 48%.
Which factors affect the dynamics of the market for heavy duty bags?
Both the Corona pandemic and political conflicts have interrupted the upswing in heavy-duty and industrial bags that has been observed for several years. Ceresana analysts expect that the 2019 level will not be reached again until 2025.
1 Market Data
1.1 Europe
1.1.1 Demand
1.1.2 Revenues
1.1.3 Applications
1.1.3.1 Carrier Bags
1.1.3.2 Garbage Bags and Sacks
1.1.3.3 Heavy Duty and Industry Sacks
1.1.3.4 Food Packaging
1.1.3.5 Other Application Areas
1.1.4 Materials
1.1.4.1 Polyethylene
1.1.4.2 Other Plastics (Films)
1.1.4.3 Plastics (woven)
1.1.4.4 Paper
2 Market Data: Country Profiles
(For each country: demand per materials, production per plastics and paper as well as export & import per plastics and paper)
2.1 Europe
2.1.1 Austria
2.1.2 Belgium
2.1.3 Czechia
2.1.4 Denmark
2.1.5 Finland
2.1.6 France
2.1.7 Germany
2.1.8 Greece
2.1.9 Hungary
2.1.10 Italy
2.1.11 Norway
2.1.12 Poland
2.1.13 Portugal
2.1.14 Romania
2.1.15 Russia
2.1.16 Slovakia
2.1.17 Slovenia
2.1.18 Spain
2.1.19 Sweden
2.1.20 The Netherlands
2.1.21 Turkey
2.1.22 United Kingdom
2.1.23 Rest of Europe
3 Company Profiles*
Austria (5 Producers)
Belarus (1)
Belgium (3)
Bosnia and Herzegovina (1)
Bulgaria (1)
Croatia (1)
Czechia (2)
Finland (5)
France (7)
Germany (10)
Ireland (1)
Italy (7)
Lithuania (1)
Norway (1)
Poland (2)
Portugal (3)
Spain (5)
Sweden (2)
Switzerland (4)
The Netherlands (6)
Turkey (3)
United Kingdom (5)
*Note: The profiles are assigned to the country in which the company or holding is headquartered. Profiles also include JVs and subsidiaries.
Graph 1: Demand for bags, sacks, and pouches in Europe from 2019 to 2031
Graph 2: Production of bags, sacks, and pouches in Europe from 2019 to 2031
Graph 3: Demand for bags, sacks, and pouches in Europe from 2019 to 2031 – split by material
Graph 4: Demand for bags, sacks, and pouches in Austria from 2019 to 2031
Graph 5: Production of bags, sacks, and pouches in Austria from 2019 to 2031
Graph 6: Demand for bags, sacks, and pouches in Belgium from 2019 to 2031
Graph 7: Production of bags, sacks, and pouches in Belgium from 2019 to 2031.
Graph 8: Demand for bags, sacks, and pouches in Czechia from 2019 to 2031
Graph 9: Production of bags, sacks, and pouches in Czechia from 2019 to 2031
Graph 10: Demand for bags, sacks, and pouches in Denmark from 2019 to 2031
Graph 11: Production of bags, sacks, and pouches in Denmark from 2019 to 2031
Graph 12: Demand for bags, sacks, and pouches in Finland from 2019 to 2031
Graph 13: Production of bags, sacks, and pouches in Finland from 2019 to 2031
Graph 14: Demand for bags, sacks, and pouches in France from 2019 to 2031
Graph 15: Production of bags, sacks, and pouches in France from 2019 to 2031
Graph 16: Demand for bags, sacks, and pouches in Germany from 2019 to 2031
Graph 17: Production of bags, sacks, and pouches in Germany from 2019 to 2031
Graph 18: Demand for bags, sacks, and pouches in Greece from 2019 to 2031
Graph 19: Production of bags, sacks, and pouches in Greece from 2019 to 2031
Graph 20: Demand for bags, sacks, and pouches in Hungary from 2019 to 2031
Graph 21: Production of bags, sacks, and pouches in Hungary from 2019 to 2031
Graph 22: Demand for bags, sacks, and pouches in Italy from 2019 to 2031
Graph 23: Production of bags, sacks, and pouches in Italy from 2019 to 2031
Graph 24: Demand for bags, sacks, and pouches in Norway from 2019 to 2031
Graph 25: Production of bags, sacks, and pouches in Norway from 2019 to 2031
Graph 26: Demand for bags, sacks, and pouches in Poland from 2019 to 2031
Graph 27: Production of bags, sacks, and pouches in Poland from 2019 to 2031
Graph 28: Demand for bags, sacks, and pouches in Portugal from 2019 to 2031
Graph 29: Production of bags, sacks, and pouches in Portugal from 2019 to 2031
Graph 30: Demand for bags, sacks, and pouches in Romania from 2019 to 2031
Graph 31: Production of bags, sacks, and pouches in Romania from 2019 to 2031
Graph 32: Demand for bags, sacks, and pouches in Russia from 2019 to 2031
Graph 33: Production of bags, sacks, and pouches in Russia from 2019 to 2031
Graph 34: Demand for bags, sacks, and pouches in Slovakia from 2019 to 2031
Graph 35: Production of bags, sacks, and pouches in Slovakia from 2019 to 2031
Graph 36: Demand for bags, sacks, and pouches in Slovenia from 2019 to 2031
Graph 37: Production of bags, sacks, and pouches in Slovenia from 2019 to 2031
Graph 38: Demand for bags, sacks, and pouches in Spain from 2019 to 2031
Graph 39: Production of bags, sacks, and pouches in Spain from 2019 to 2031
Graph 40: Demand for bags, sacks, and pouches in Sweden from 2019 to 2031
Graph 41: Production of bags, sacks, and pouches in Sweden from 2019 to 2031
Graph 42: Demand for bags, sacks, and pouches in the Netherlands from 2019 to 2031
Graph 43: Production of bags, sacks, and pouches in the Netherlands from 2019 to 2031
Graph 44: Demand for bags, sacks, and pouches in Turkey from 2019 to 2031
Graph 45: Production of bags, sacks, and pouches in Turkey from 2019 to 2031
Graph 46: Demand for bags, sacks, and pouches in the United Kingdom from 2019 to 2031
Graph 47: Production of bags, sacks, and pouches in the United Kingdom from 2019 to 2031
Graph 48: Demand for bags, sacks, and pouches in the remaining countries of Western Europe from 2019 to 2031
Graph 49 Production of bags, sacks, and pouches in the remaining countries of Western Europe from 2019 to 2031
Table 1: Demand for bags, sacks, and pouches in Europe from 2019 to 2031 – split by countries
Table 2: Production of bags, sacks, and pouches in Europe from 2019 to 2031 – split by countries
Table 3: Demand for plastic bags, sacks, and pouches in Europe from 2019 to 2031 – split by applications
Table 4: Demand for paper bags, sacks, and pouches in Europe from 2019 to 2031 – split by applications
Table 5: Demand for plastic carrier bags in Europe from 2019 to 2031 – split by countries
Table 6: Demand for paper carrier bags in Europe from 2019 to 2031 – split by countries
Table 7: Demand for plastic garbage bags and sacks in Europe from 2019 to 2031 – split by countries
Table 8: Demand for plastic heavy duty and industry sacks in Europe from 2019 to 2031 – split by countries
Table 9: Demand for heavy duty and industry sacks made of paper in Europe from 2019 to 2031 – split by countries
Table 10: Demand for food packaging made of plastic in Europe from 2019 to 2031 – split by countries
Table 11: Demand for food packaging made of paper in Europe from 2019 to 2031 – split by countries
Table 12: European demand for plastic bags, sacks and pouches in the segment other applications from 2019 to 2031 – split by countries
Table 13: Demand for paper bags, sacks, and pouches in other applications in Europe from 2019 to 2031 – split by countries
Table 14: Demand for bags, sacks, and pouches in Europe from 2019 to 2031 – split by material
Table 15: Demand for bags, sacks, and pouches made of polyethylene film in Europe from 2019 to 2031 – split by countries
Table 16: Demand for bags, sacks, and pouches made of other plastic films in Europe from 2019 to 2031 – split by countries
Table 17: Demand for bags, sacks, and pouches made of woven plastics in Europe from 2019 to 2031 – split by countries
Table 18: Demand for bags, sacks and pouches made of paper in Europe from 2019 to 2031 – split by countries
Table 19: Demand for bags, sacks, and pouches in Austria from 2019 to 2031 – split by materials
Table 20: Production, import, and export of and demand for bags, sacks, and pouches in Austria from 2019 to 2031
Table 21: Production of bags, sacks, and pouches in Austria from 2019 to 2031 – split by materials
Table 22: Import and export of bags, sacks, and pouches in Austria from 2019 to 2031 – split by materials
Table 23: Demand for bags, sacks, and pouches in Belgium from 2019 to 2031 – split by material
Table 24: Production, import, and export of and demand for bags, sacks and pouches in Belgium from 2019 to 2031
Table 25: Production of bags, sacks, and pouches in Belgium from 2019 to 2031 – split by material
Table 26: Import and export of bags, sacks, and pouches in Belgium from 2019 to 2031 – split by material
Table 27: Demand for bags, sacks, and pouches in Czechia from 2019 to 2031 – split by materials
Table 28: Production, import, and export of and demand for bags, sacks, and pouches in Czechia from 2019 to 2031
Table 29: Production of bags, sacks, and pouches in Czechia from 2019 to 2031 – split by materials
Table 30: Import and export of bags, sacks, and pouches in Czechia from 2019 to 2031 – split by materials
Table 31: Demand for bags, sacks, and pouches in Denmark from 2019 to 2031 – split by material
Table 32: Production, import, and export of and demand for bags, sacks, and pouches in Denmark from 2019 to 2031
Table 33: Production of bags, sacks, and pouches in Denmark from 2019 to 2031 – split by material
Table 34: Import and export of bags, sacks, and pouches in Denmark from 2019 to 2031 – split by material
Table 35: Demand for bags, sacks, and pouches in Finland from 2019 to 2031 – split by materials
Table 36: Production, import, and export of and demand for bags, sacks, and pouches in Finland from 2019 to 2031
Table 37: Production of bags, sacks, and pouches in Finland from 2019 to 2031 – split by materials
Table 38: Import and export of bags, sacks, and pouches in Finland from 2019 to 2031 – split by materials
Table 39: Demand for plastic bags, sacks, and pouches in France from 2019 to 2031 – split by applications
Table 40: Demand for paper bags, sacks, and pouches in France from 2019 to 2031 – split by applications
Table 41: Demand for bags, sacks, and pouches in France from 2019 to 2031 – split by materials
Table 42: Production, import and export of and demand for bags, sacks, and pouches in France from 2019 to 2031
Table 43: Production of bags, sacks, and pouches in France from 2019 to 2031 – split by material
Table 44: Import and export of bags, sacks, and pouches in France from 2019 to 2031 – split by materials
Table 45: Demand for plastic bags, sacks, and pouches in Germany from 2019 to 2031 – split by applications
Table 46: Demand for paper bags, sacks, and pouches in Germany from 2019 to 2031 – split by applications
Table 47: Demand for bags, sacks, and pouches in Germany from 2019 to 2031 – split by material
Table 48: Production, import and export of and demand for bags, sacks, and pouches in Germany from 2019 to 2031
Table 49: Production of bags, sacks, and pouches in Germany from 2019 to 2031 – split by material
Table 50: Import and export of bags, sacks, and pouches in Germany from 2019 to 2031 – split by materials
Table 51: Demand for bags, sacks, and pouches in Greece from 2019 to 2031 – split by materials
Table 52: Production, import, and export of and demand for bags, sacks, and pouches in Greece from 2019 to 2031
Table 53: Production of bags, sacks, and pouches in Greece from 2019 to 2031 – split by materials
Table 54: Import and export of bags, sacks, and pouches in Greece from 2019 to 2031 – split by materials
Table 55: Production, import, and export of and demand for bags, sacks, and pouches in Hungary from 2019 to 2031
Table 56: Production of bags, sacks, and pouches in Hungary from 2019 to 2031 – split by materials
Table 57: Import and export of bags, sacks, and pouches in Hungary from 2019 to 2031 – split by materials
Table 58: Demand for plastic bags, sacks, and pouches in Italy from 2019 to 2031 – split by applications
Table 59: Demand for paper bags, sacks, and pouches in Italy from 2019 to 2031 – split by applications
Table 60: Demand for bags, sacks, and pouches in Italy from 2019 to 2031 – split by material
Table 61: Production, import and export of and demand for bags, sacks, and pouches in Italy from 2019 to 2031
Table 62: Production of bags, sacks, and pouches in Italy from 2019 to 2031 – split by material
Table 63: Import and export of bags, sacks, and pouches in Italy from 2019 to 2031 – split by materials
Table 65: Production, import, and export of and demand for bags, sacks, and pouches in Norway from 2019 to 2031
Table 66: Production of bags, sacks, and pouches in Norway from 2019 to 2031 – split by materials
Table 67: Import and export of bags, sacks, and pouches in Norway from 2019 to 2031 – split by materials
Table 68: Demand for plastic bags, sacks, and pouches in Poland from 2019 to 2031 – split by applications
Table 69: Demand for paper bags, sacks, and pouches in Poland from 2019 to 2031 – split by applications
Table 70: Demand for bags, sacks, and pouches in Poland from 2019 to 2031 – split by material
Table 71: Production, import and export of and demand for bags, sacks, and pouches in Poland from 2019 to 2031
Table 72: Production of bags, sacks, and pouches in Poland from 2019 to 2031 – split by materials
Table 73: Import and export of bags, sacks, and pouches in Poland from 2019 to 2031 – split by materials
Table 74: Demand for bags, sacks, and pouches in Portugal from 2019 to 2031 – split by materials
Table 75: Production, import, and export of and demand for bags, sacks, and pouches in Portugal from 2019 to 2031
Table 76: Production of bags, sacks, and pouches in Portugal from 2019 to 2031 – split by materials
Table 77: Demand for bags, sacks, and pouches in Portugal from 2019 to 2031 – split by materials
Table 78: Demand for bags, sacks, and pouches in Romania from 2019 to 2031 – split by materials
Table 79: Production, import, and export of and demand for bags, sacks, and pouches in Romania from 2019 to 2031
Table 80: Production of bags, sacks, and pouches in Romania from 2019 to 2031 – split by materials
Table 81: Import and export of bags, sacks, and pouches in Romania from 2019 to 2031 – split by materials
Table 82: Demand for plastic bags, sacks, and pouches in Russia from 2019 to 2031 – split by applications
Table 83: Demand for paper bags, sacks, and pouches in Russia from 2019 to 2031 – split by applications
Table 84: Demand for bags, sacks, and pouches in Russia from 2019 to 2031 – split by materials
Table 85: Production, import and export of and demand for bags, sacks, and pouches in Russia from 2019 to 2031
Table 86: Production of bags, sacks, and pouches in Russia from 2019 to 2031 – split by materials
Table 87: Import and export of bags, sacks, and pouches in Russia from 2019 to 2031 – split by materials
Table 88: Demand for bags, sacks, and pouches in Slovakia from 2019 to 2031 – split by materials
Table 89: Production, import, and export of and demand for bags, sacks, and pouches in Slovakia from 2019 to 2031
Table 90: Production of bags, sacks, and pouches in Slovakia from 2019 to 2031 – split by materials
Table 91: Import and export of bags, sacks, and pouches in Slovakia from 2019 to 2031 – split by materials
Table 92: Demand for bags, sacks, and pouches in Slovenia from 2019 to 2031 – split by materials
Table 93: Production, import, and export of and demand for bags, sacks, and pouches in Slovenia from 2019 to 2031
Table 94: Production of bags, sacks, and pouches in Slovenia from 2019 to 2031 – split by materials
Table 95: Import and export of bags, sacks, and pouches in Slovenia from 2019 to 2031 – split by materials
Table 96: Demand for plastic bags, sacks, and pouches in Spain from 2019 to 2031 – split by applications
Table 97: Demand for paper bags, sacks, and pouches in Spain from 2019 to 2031 – split by applications
Table 98: Demand for bags, sacks, and pouches in Spain from 2019 to 2031 – split by materials
Table 99: Production, import and export of and demand for bags, sacks, and pouches in Spain from 2019 to 2031
Table 100: Production of bags, sacks, and pouches in Spain from 2019 to 2031 – split by material
Table 101: Import and export of bags, sacks, and pouches in Spain from 2019 to 2031 – split by materials
Table 102: Demand for bags, sacks, and pouches in Sweden from 2019 to 2031 – split by materials
Table 103: Production, import, and export of and demand for bags, sacks, and pouches in Sweden from 2019 to 2031
Table 104: Production of bags, sacks, and pouches in Sweden from 2019 to 2031 – split by materials
Table 105: Import and export of bags, sacks, and pouches in Sweden from 2019 to 2031 – split by materials
Table 106: Demand for bags, sacks, and pouches in the Netherlands from 2019 to 2031 – split by materials
Table 107: Production, import, and export of and demand for bags, sacks, and pouches in the Netherlands from 2019 to 2031
Table 108: Production of bags, sacks, and pouches in the Netherlands from 2019 to 2031 – split by materials
Table 109: Import and export of bags, sacks, and pouches in the Netherlands from 2019 to 2031 – split by materials
Table 110: Demand for plastic bags, sacks, and pouches in Turkey from 2019 to 2031 – split by applications
Table 111: Demand for paper bags, sacks, and pouches in Turkey from 2019 to 2031 – split by applications
Table 112: Demand for bags, sacks, and pouches in Turkey from 2019 to 2031 – split by materials
Table 113: Production, import, and export of and demand for bags, sacks, and pouches in Turkey from 2019 to 2031
Table 114: Production of bags, sacks, and pouches in Turkey from 2019 to 2031 – split by material
Table 115: Import and export of bags, sacks, and pouches in Turkey from 2019 to 2031 – split by materials
Table 116: Demand for plastic bags, sacks, and pouches in the United Kingdom from 2019 to 2031 – split by applications
Table 117: Demand for paper bags, sacks, and pouches in the United Kingdom from 2019 to 2031 – split by applications
Table 118: Demand for bags, sacks, and pouches in the United Kingdom from 2019 to 2031 – split by materials
Table 119: Production, import and export of and demand for bags, sacks, and pouches in the United Kingdom from 2019 to 2031
Table 120: Production of bags, sacks, and pouches in the United Kingdom from 2019 to 2031 – split by material
Table 121: Import and export of bags, sacks, and pouches in the United Kingdom from 2019 to 2031 – split by materials
Table 122: Demand for bags, sacks, and pouches in th remaining countries of Western Europe from 2019 to 2031 – split by material
Table 123: Production, import, and export of and demand for bags, sacks, and pouches in the remaining countries of Western Europe from 2019 to 2031
Table 124: Production of bags, sacks, and pouches in the remaining countries of Western Europe from 2019 to 2031 – split by material
Table 125: Import and export of bags, sacks, and pouches in the remaining countries of Western Europe from 2019 to 2031 – split by materials


