

Description
The Printing Inks Market Report – World is now also available in parts (e.g. individual country profiles or all manufacturer profiles). Please feel free to contact us and we will immediately send you an offer for your specific selection.
Are young people returning to printed books, or at least to books-on-demand or photo books? In any case, the decline in this sector of the printing industry is slowing down. By contrast, the slump in magazine printing and newspaper printing has even accelerated since last year: The migration of readers and advertising customers to digital worlds is probably unstoppable. The latest edition of Ceresana’s global printing inks market report shows opposing trends: Publication printing continues to decrease, including the printing of advertising brochures and catalogs. However, demand for other print products is increasing. Despite trade wars and disrupted supply chains, growing consumption, particularly in the emerging markets, is driving packaging printing, for example of labels. Not only packaging of all kinds is printed, but also products such as decorative papers and textiles. Market researchers at Ceresana forecast that global demand for printing inks will increase by an average of 0.9% annually until 2034. The various regions of the world, areas of application, and printing processes are expected to develop very differently.
Opportunities and Challenges for Printing Inks
E-commerce and the packaging boom are driving demand for shipping packaging made of flexible plastics and corrugated cardboard in particular, but also for shrink labels, shrink sleeves, aseptic packaging, beverage packaging, and specially coated packaging paper. With smaller batches and more frequent redesigns, the number of print jobs grows, while at the same time print runs decrease as product variants increase. In addition to the “explosion” of SKU identification codes, government regulations and increasingly stringent traceability requirements are accelerating the need for functional and variable printing solutions. Flexographic and inkjet printing processes in particular are benefiting from the fact that flexibility and individualization are becoming more and more important. UV flexographic printing and high-speed inkjet offer a technology upgrade, for example the direct printing of 3D objects. When it comes to short runs and commercial printing such as in the office sector, digital printing with electrophotography is also showing solid growth. Offset is generally suffering from the decline of publication printing. However, UV offset printing opens up new applications, such as folding boxes or plastic films. The packaging market is very heterogeneous. In the printing ink market study, country-specific particularities are therefore outlined in individual country profiles for the most important countries.
Green Printing with Bio-Based Printing Inks
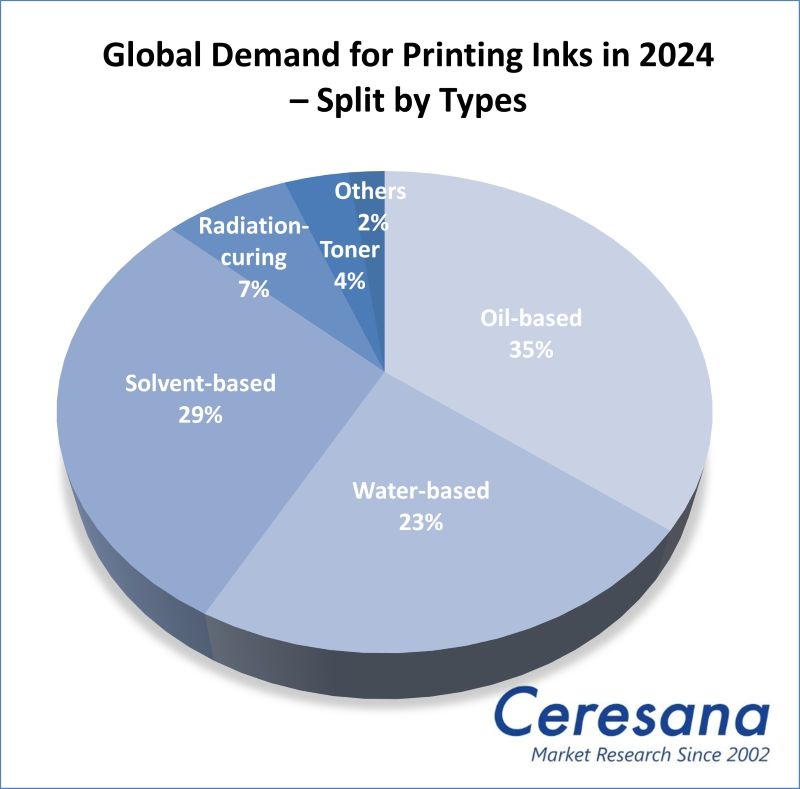
The use of energy-saving and more environmentally friendly printing processes is increasing significantly. VOC-free products that do not release any volatile organic compounds, i.e. water-based printing inks and radiation-curing UV printing inks, benefit in particular from the increasingly strict labeling requirements and regulations for chemicals and food contact materials. Bio-based printing inks do not release any toxic heavy metals. A reduced mineral oil content is not only beneficial for recycling or composting paper packaging. Bio-based solvents are at least partially made from renewable raw materials such as vegetable oils or alcohols. On the other hand, the trend towards environmental friendliness can reduce the amount of ink required, for example because packaging materials are saved and ink layers become thinner or areas remain completely unprinted. Ceresana’s current market overview provides concrete printing inks market data, e.g. figures on the individual printing ink types. For example, global demand for inkjet printing inks in the packaging printing segment is expected to grow by more than 11% per year.
Current Global Printing Inks Market Report:
Chapter 1 provides all important key figures for the global printing inks market, including forecasts up to 2034: For each region of the world, data on production, demand, and revenues are given. Revenues are given in billion US dollars and billion euros, all other figures are given in 1,000 tonnes. The demand for printing inks is broken down by relevant subcategories, including the analysis of various application areas, printing processes, and packaging types.
For 7 application areas, the revenues generated with and the demand for printing inks are broken down:
- Books
- Magazines
- Newspapers
- Advertising and catalogs
- Labels
- Packaging
- Other Applications
The demand for printing inks is also analyzed:
- split by 8 printing processes:
– Heat-set web offset printing
– Cold-set web offset printing
– Sheet-fed offset printing
– Flexographic printing
– Gravure printing
– Other analog printing
– Inkjet printing
– Electrophotography
- split by 6 printing ink types:
– Oil-based inks (e.g. linseed oil inks)
– Water-based inks (e.g. latex inks)
– Solvent-based inks (e.g. PVB inks)
– Radiation-curing inks (e.g. UV inks or electron beam inks)
– Toner
– Other printing inks
- split by 6 packaging types (at global level):
– Rigid plastic packaging
– Flexible plastic packaging
– Packaging papers
– Folding cartons
– Corrugated board packaging
– Other packaging
The demand for printing inks in each of the seven application areas mentioned is shown separately for all eight printing processes. This makes it possible to see at a glance, for example, how high the demand for flexographic printing inks is in the “packaging” sector or the demand for coldset inks in the “newspaper” sector.
In Chapter 2, the 17 most important national markets for printing inks are examined in detail. For each country, comprehensive data on production, import, export, demand, and revenues are given. The demand is subdivided according to application areas, printing processes, and printing ink types. In addition, the demand per printing process is split by the individual application areas (e.g. demand for inkjet printing inks in the “packaging” segment). Sales are also broken down into application areas.
Chapter 3 provides company profiles of the most important printing inks manufacturers – clearly arranged according to contact details, revenues, net income, product range, production sites, and profile summary. Detailed profiles of 40 printing ink manufacturers are supplied, such as ALTANA AG, Avient Corporation, Avery Dennison Corporation, DuPont de Nemours, Inc., Fujifilm Holdings Corp., Kao Corporation, and International Paper Company.
=> Ceresana regularly analyzes the European and global printing ink markets. Ingredients of printing inks are also a topic for well-founded Ceresana studies: solvents, surfactants, and pigments. Current market reports on various packaging materials and their areas of application, such as plastic films, labels, cardboard and paperboard packaging, food packaging and packaging for cosmetics and personal care products, are also relevant for the printing industry. A particular focus of Ceresana’s market research is on bio-based products. Ceresana also organizes online events on the bio-economy, for example on bioplastics and bio-based packaging.
Scope of the Report:
Attributes | Details |
| Base Year | 2024 |
| Trend Period | 2022 – 2034 |
| Forecast Period | 2025 – 2034 |
| Pages | 470 |
| Application Areas | Books, magazines, newspapers, advertising & catalogs, labels, packaging, other |
| Printing Processes | Heatset web offset, coldset web offset, sheetfed offset, flexo, gravure, other analog printing, inkjet, electrophotography |
| Printing Ink Types | Oil-based, water-based, solvent-based, radiation-curing, toner, other |
| Packaging Types | Rigid plastic packaging, flexible plastic packaging, packaging papers, folding cartons, corrugated board packaging, other |
| Company Profiles | ALTANA, Avient, Avery Dennison, DuPont, Fujifilm, Kao, and International Paper (Selection) |
| Edition | 6th edition |
| Publication | November 2025 |
FAQs
How is global demand for printing inks expected to change?
The study forecasts that total demand for printing inks will increase by an average of 0.9% per year until 2034. However, there are major differences between the various countries, application areas, and printing processes.
Which application areas are showing increased demand?
Currently, demand for printing inks is particularly increasing in the packaging segment for products such as shipping packaging made of flexible plastics and corrugated cardboard, but also for shrink labels, shrink sleeves, aseptic packaging, beverage packaging, and specially coated packaging paper.
Which trends are affecting the market for printing inks?
With smaller batches and more frequent redesigns, the number of print jobs grows, while at the same time print runs decrease as product variants increase. In addition to the “explosion” of SKU identification codes, government regulations and increasingly stringent traceability requirements are accelerating the need for functional and variable printing solutions. Moreover, the use of energy-saving and more environmentally friendly printing processes is increasing significantly.
1 Market Data: World and Regions
1.1 World
1.1.1 Demand
1.1.2 Revenues
1.1.3 Production
1.1.4 Demand per Application Area
1.1.4.1 Books
1.1.4.2 Magazines
1.1.4.3 Newspaper
1.1.4.4 Advertising and Catalogs
1.1.4.5 Labels
1.1.4.6 Packaging
1.1.4.7 Other
1.1.5 Demand per Packaging Types
1.1.6 Revenues per Application Area
1.1.6.1 Books
1.1.6.2 Magazines
1.1.6.3 Newspaper
1.1.6.4 Advertising and Catalogs
1.1.6.5 Labels
1.1.6.6 Packaging
1.1.6.7 Other
1.1.7 Demand per Printing Processes
1.1.7.1 Heatset Web Offset
1.1.7.2 Coldset Web Offset
1.1.7.3 Sheetfed Offset
1.1.7.4 Flexo
1.1.7.5 Gravure
1.1.7.6 Other Analog Printing
1.1.7.7 Inkjet
1.1.7.8 Electrophotography
1.1.8 Demand per Printing Process split by Applications
1.1.8.1 Heatset Web Offset per Application
1.1.8.2 Coldset Web Offset per Application
1.1.8.3 Sheetfed Offset per Application
1.1.8.4 Flexo per Application
1.1.8.5 Gravure per Application
1.1.8.6 Other Analog Printing per Application
1.1.8.7 Inkjet per Application
1.1.8.8 Electrophotography per Application
1.1.9 Demand per Printing Ink Types
1.1.9.1 Oil-based
1.1.9.2 Water-based
1.1.9.3 Solvent-based
1.1.9.4 Radiation-curing
1.1.9.5 Toner
1.1.9.6 Others
1.2 Western Europe
1.2.1 Demand
1.2.2 Revenues
1.2.3 Applications, Printing Processes & Ink Types
1.3 Eastern Europe
1.3.1 Demand
1.3.2 Revenues
1.3.3 Production
1.3.4 Applications, Printing Processes & Ink Types
1.4 North America
1.4.1 Demand
1.4.2 Revenues
1.4.3 Production
1.4.4 Applications, Printing Processes & Ink Types
1.5 South America
1.5.1 Demand
1.5.2 Revenues
1.5.3 Production
1.5.4 Applications, Printing Processes & Ink Types
1.6 Asia-Pacific
1.6.1 Demand
1.6.2 Revenues
1.6.3 Production
1.6.4 Applications, Printing Processes & Ink Types
1.7 Middle East
1.7.1 Demand
1.7.2 Revenues
1.7.3 Production
1.7.4 Applications, Printing Processes & Ink Types
1.8 Africa
1.8.1 Demand
1.8.2 Revenues
1.8.3 Production
1.8.4 Applications, Printing Processes & Ink Types
1.9 Excursus: Regulations and Directives in the European Union (EU)
1.9.1 General Information
1.9.2 Packaging Market
2 Market Data: Countries
(For each country: Production, import, and export, revenues per application, demand per application, printing process, printing ink type, and printing process split by application)
2.1 Western Europe
2.1.1 France
2.1.1.1 Demand and Revenues
2.1.1.2 Production and Trade
2.1.2 Germany
2.1.2.1 Demand and Revenues
2.1.2.2 Production and Trade
2.1.3 Italy
2.1.3.1 Demand and Revenues
2.1.3.2 Production and Trade
2.1.4 Spain
2.1.4.1 Demand and Revenues
2.1.4.2 Production and Trade
2.1.5 The Netherlands
2.1.5.1 Demand and Revenues
2.1.5.2 Production and Trade
2.1.6 United Kingdom
2.1.6.1 Demand and Revenues
2.1.6.2 Production and Trade
2.1.7 Other Western Europe
2.1.7.1 Demand and Revenues
2.1.7.2 Production and Trade
2.2 Eastern Europe
2.2.1 Poland
2.2.1.1 Demand and Revenues
2.2.1.2 Production and Trade
2.2.2 Russia
2.2.2.1 Demand and Revenues
2.2.2.2 Production and Trade
2.2.3 Türkiye
2.2.3.1 Demand and Revenues
2.2.3.2 Production and Trade
2.2.4 Other Eastern Europe
2.2.4.1 Demand and Revenues
2.2.4.2 Production and Trade
2.3 North America
2.3.1 Canada
2.3.1.1 Demand and Revenues
2.3.1.2 Production and Trade
2.3.2 Mexico
2.3.2.1 Demand and Revenues
2.3.2.2 Production and Trade
2.3.3 USA
2.3.3.1 Demand and Revenues
2.3.3.2 Production and Trade
2.4 South America
2.4.1 Brazil
2.4.1.1 Demand and Revenues
2.4.1.2 Production and Trade
2.4.2 Other South America
2.4.2.1 Demand and Revenues
2.4.2.2 Production and Trade
2.5 Asia-Pacific
2.5.1 China
2.5.1.1 Demand and Revenues
2.5.1.2 Production and Trade
2.5.2 India
2.5.2.1 Demand and Revenues
2.5.2.2 Production and Trade
2.5.3 Japan
2.5.3.1 Demand and Revenues
2.5.3.2 Production and Trade
2.5.4 South Korea
2.5.4.1 Demand and Revenues
2.5.4.2 Production and Trade
2.5.5 Other Asia-Pacific
2.5.5.1 Demand and Revenues
2.5.5.2 Production and Trade
3 Company Profiles*
3.1 Western Europe
Belgium (1 Producer)
Germany (7)
Italy (1)
Luxembourg (1)
Switzerland (1)
United Kingdom (1)
3.2 Eastern Europe
Greece (1)
Türkiye (1)
3.3 North America
Mexico (1)
USA (10)
3.4 Asia-Pacific
China (4)
India (1)
Japan (10)
*Note: The profiles are assigned to the country in which the company or holding is headquartered. Profiles also include JVs and subsidiaries.
Graph 1: Global demand from 2022 to 2034
Graph 2: Global demand from 2022 to 2034 – split by region
Graph 3: Global revenues from 2022 to 2034 in billion USD and billion EUR
Graph 4: Global revenues from 2022 to 2034 in billion USD – split by region
Graph 5: Global revenues from 2022 to 2034 in billion EUR – split by region
Graph 6: Global production from 2022 to 2034
Graph 7: Global production from 2022 to 2034 – split by region
Graph 8: Global demand from 2022 to 2034 – split by application
Graph 9: Global demand in the “books” segment from 2022 to 2034 – split by region
Graph 10: Global demand in the “magazines” segment from 2022 to 2034 – split by region
Graph 11: Global demand in the “newspaper” segment from 2022 to 2034 – split by region
Graph 12: Global demand in the “advertising and catalogs” segment from 2022 to 2034 – split by region
Graph 13: Global demand in the “labels” segment from 2022 to 2034 – split by region
Graph 14: Global demand in the “packaging” segment from 2022 to 2034 – split by region
Graph 15: Global demand in the “other applications” segment from 2022 to 2034 – split by region
Graph 16: Global demand from 2022 to 2034 – split by printing process
Graph 17: Global demand for “heatset printing inks” from 2022 to 2034 – split by region
Graph 18: Global demand for “coldset printing inks” from 2022 to 2034 – split by region
Graph 19: Global demand for “sheetfed offset printing inks” from 2022 to 2034 – split by region
Graph 20: Global demand for “flexographic printing inks” from 2022 to 2034 – split by region
Graph 21: Global demand for “gravure printing inks” from 2022 to 2034 – split by region
Graph 22: Global demand for “other analog printing inks” from 2022 to 2034 – split by region
Graph 23: Global demand for “inkjet printing inks” from 2022 to 2034 – split by region
Graph 24: Global demand for “toner” from 2022 to 2034 – split by region
Graph 25: Demand in Western Europe from 2022 to 2034
Graph 26: Revenues generated in Western Europe from 2022 to 2034 in billion USD and billion EUR
Graph 27: Production in Western Europe from 2022 to 2034
Graph 28: Demand in Western Europe from 2022 to 2034 – split by application
Graph 29: Demand in Eastern Europe from 2022 to 2034
Graph 30: Revenues generated in Eastern Europe from 2022 to 2034, in billion USD and billion EUR
Graph 31: Production in Eastern Europe from 2022 to 2034
Graph 32: Demand in Eastern Europe from 2022 to 2034 – split by application
Graph 33: Demand in North America from 2022 to 2034
Graph 34: Revenues generated in North America from 2022 to 2034, in billion USD and billion EUR
Graph 35: Production in North America from 2022 to 2034
Graph 36: Demand in North America from 2022 to 2034 – split by application
Graph 37: Demand in South America from 2022 to 2034
Graph 38: Revenues generated in South America from 2022 to 2034, in billion USD and billion EUR
Graph 39: Production in South America from 2022 to 2034
Graph 40: Demand in South America from 2022 to 2034 – split by application
Graph 41: Demand in Asia-Pacific from 2022 to 2034
Graph 42: Revenues generated in Asia-Pacific from 2022 to 2034, in billion USD and billion EUR
Graph 43: Production in Asia-Pacific from 2022 to 2034
Graph 44: Demand in Asia-Pacific from 2022 to 2034 – split by application
Graph 45: Demand in the Middle East from 2022 to 2034
Graph 46: Revenues generated in the Middle East from 2022 to 2034, in billion USD and billion EUR
Graph 47: Production in the Middle East from 2022 to 2034
Graph 48: Demand in the Middle East from 2022 to 2034 – split by application
Graph 49: Demand in Africa from 2022 to 2034
Graph 50: Revenues generated in Africa from 2022 to 2034, in billion USD and billion EUR
Graph 51: Production in Africa from 2022 to 2034
Graph 52: Demand in Africa from 2022 to 2034 – split by application
Graph 53: Demand in France from 2022 to 2034
Graph 54: Production in France from 2022 to 2034
Graph 55: Demand in Germany from 2022 to 2034
Graph 56: Production in Germany from 2022 to 2034
Graph 57: Demand in Italy from 2022 to 2034
Graph 58: Production in Italy from 2022 to 2034
Graph 59: Demand in Spain from 2022 to 2034
Graph 60: Production in Spain from 2022 to 2034
Graph 61: Demand in the Netherlands from 2022 to 2034
Graph 62: Production in the Netherlands from 2022 to 2034
Graph 63: Demand in the United Kingdom from 2022 to 2034
Graph 64: Production in the United Kingdom from 2022 to 2034
Graph 65: Demand in Other Western Europe from 2022 to 2034
Graph 66: Production in Other Western Europe from 2022 to 2034
Graph 67: Demand in Poland from 2022 to 2034
Graph 68: Production in Poland from 2022 to 2034
Graph 69: Demand in Russia from 2022 to 2034
Graph 70: Production in Russia from 2022 to 2034
Graph 71: Demand in Türkiye from 2022 to 2034
Graph 72: Production in Türkiye from 2022 to 2034
Graph 73: Demand in Other Eastern Europe from 2022 to 2034
Graph 74: Production in Other Eastern Europe from 2022 to 2034
Graph 75: Demand in Canada from 2022 to 2034
Graph 76: Production in Canada from 2022 to 2034
Graph 77: Demand in Mexico from 2022 to 2034
Graph 78: Production in Mexico from 2022 to 2034
Graph 79: Demand in the USA from 2022 to 2034
Graph 80: Production in the USA from 2022 to 2034
Graph 81: Demand in Brazil from 2022 to 2034
Graph 82: Production in Brazil from 2022 to 2034
Graph 83: Demand in Other South America from 2022 to 2034
Graph 84: Production in Other South America from 2022 to 2034
Graph 85: Demand in China from 2022 to 2034
Graph 86: Production in China from 2022 to 2034
Graph 87: Demand in India from 2022 to 2034
Graph 88: Production in India from 2022 to 2034
Graph 89: Demand in Japan from 2022 to 2034
Graph 90: Production in Japan from 2022 to 2034
Graph 91: Demand in South Korea from 2022 to 2034
Graph 92: Production in South Korea from 2022 to 2034
Graph 93: Demand in Other Asia-Pacific from 2022 to 2034
Graph 94: Production in Other Asia-Pacific from 2022 to 2034
Table 1: Global demand from 2022 to 2034 – split by region
Table 2: Global revenues from 2022 to 2034 in million USD – split by region
Table 3: Global revenues from 2022 to 2034 in million EUR – split by region
Table 4: Global production from 2022 to 2034 – split by region
Table 5: Global demand from 2022 to 2034 – split by application
Table 6: Global demand in the “books” segment from 2022 to 2034 – split by region
Table 7: Global demand in the “magazines” segment from 2022 to 2034 – split by region
Table 8: Global demand in the “newspaper” segment from 2022 to 2034 – split by region
Table 9: Global demand in the “advertising and catalogs” segment from 2022 to 2034 – split by region
Table 10: Global demand in the “labels” segment from 2022 to 2034 – split by region
Table 11: Global demand in the “packaging” segment from 2022 to 2034 – split by region
Table 12: Global demand in the “other applications” segment from 2022 to 2034 – split by region
Table 13: Demand for printing inks in the “packaging” segment from 2022 to 2034 – split by packaging type
Table 14: Global revenues from 2022 to 2034 – split by application
Table15: Global revenues generated in the “books” segment from 2022 to 2034 – split by region
Table 16: Global revenues generated in the “magazines” segment from 2022 to 2034 – split by region
Table 17: Global revenues generated in the “newspaper” segment from 2022 to 2034 – split by region
Table 18: Global revenues generated in the “advertising and catalogs” segment from 2022 to 2034 – split by region
Table 19: Global revenues generated in the “labels” segment from 2022 to 2034 – split by region
Table 20: Global revenues generated in the “packaging” segment from 2022 to 2034 – split by region
Table 21: Global revenues generated in the “other applications” segment from 2022 to 2034 – split by region
Table 22: Global demand from 2022 to 2034 – split by printing process
Table 23: Global demand for “heatset printing inks” from 2022 to 2034 – split by region
Table 24: Global demand for “coldset printing inks” from 2022 to 2034 – split by region
Table 25: Global demand for “sheetfed offset printing inks” from 2022 to 2034 – split by region
Table 26: Global demand for “flexographic printing inks” from 2022 to 2034 – split by region
Table 27: Global demand for “gravure printing inks” from 2022 to 2034 – split by region
Table 28: Global demand for “other analog printing inks” from 2022 to 2034 – split by region
Table 29: Global demand for “inkjet printing inks” from 2022 to 2034 – split by region
Table 30: Global demand for “toner” from 2022 to 2034 – split by region
Table 31: Global demand for “heatset printing inks” from 2022 to 2034 – split by application
Table 32: Global demand for “coldset printing inks” from 2022 to 2034 – split by application
Table 33: Global demand for “sheetfed offset printing inks” from 2022 to 2034 – split by application
Table 34: Global demand for “flexographic printing inks” from 2022 to 2034 – split by application
Table 35: Global demand for “gravure printing inks” from 2022 to 2034 – split by application
Table 36: Global demand for “other analog printing inks” from 2022 to 2034 – split by application
Table 37: Global demand for “inkjet printing inks” from 2022 to 2034 – split by application
Table 38: Global demand for “toner” from 2022 to 2034 – split by application
Table 39: Global demand from 2022 to 2034 – split by printing ink type
Table 40: Global demand for “oil-based printing inks” from 2022 to 2034 – split by region
Table 41: Global demand for “water-based printing inks” from 2022 to 2034 – split by region
Table 42: Global demand for “solvent-based printing inks” from 2022 to 2034 – split by region
Table 43: Global demand for “radiation-curing printing inks” from 2022 to 2034 – split by region
Table 44: Global demand for “toner” from 2022 to 2034 – split by region
Table 45: Global demand for “other printing ink types” from 2022 to 2034 – split by region
Table 46: Demand in Western Europe from 2022 to 2034 – split by major country
Table 47: Revenues generated in Western Europe from 2022 to 2034, in million USD and million EUR
Table 48: Revenues generated in Western Europe from 2022 to 2034 – split by application
Table 49: Production in Western Europe from 2022 to 2034 – split by major country
Table 50: Demand in Western Europe from 2022 to 2034 – split by application
Table 51: Demand in Western Europe from 2022 to 2034 – split by printing process
Table 52: Demand for “heatset printing inks” in Western Europe from 2022 to 2034 – split by application
Table 53: Demand for “coldset printing inks” in Western Europe from 2022 to 2034 – split by application
Table 54: Demand for “sheetfed offset printing inks” in Western Europe from 2022 to 2034 – split by application
Table 55: Demand for “flexographic printing inks” in Western Europe from 2022 to 2034 – split by application
Table 56: Demand for “gravure printing inks” in Western Europe from 2022 to 2034 – split by application
Table 57: Demand for “other analog printing inks” in Western Europe from 2022 to 2034 – split by application
Table 58: Demand for “inkjet printing inks” in Western Europe from 2022 to 2034 – split by application
Table 59: Demand for “toner” in Western Europe from 2022 to 2034 – split by application
Table 60: Demand in Western Europe from 2022 to 2034 – split by printing ink type
Table 61: Demand in Eastern Europe from 2022 to 2034 – split by major country
Table 62: Revenues generated in Eastern Europe from 2022 to 2034, in million USD and million EUR
Table 63: Revenues generated in Eastern Europe from 2022 to 2034 – split by application
Table 64: Production in Eastern Europe from 2022 to 2034 – split by major country
Table 65: Demand in Eastern Europe from 2022 to 2034 – split by application
Table 66: Demand in Eastern Europe from 2022 to 2034 – split by printing process
Table 67: Demand for “heatset printing inks” in Eastern Europe from 2022 to 2034 – split by application
Table 68: Demand for “coldset printing inks” in Eastern Europe from 2022 to 2034 – split by application
Table 69: Demand for “sheetfed offset printing inks” in Eastern Europe from 2022 to 2034 – split by application
Table 70: Demand for “flexographic printing inks” in Eastern Europe from 2022 to 2034 – split by application
Table 71: Demand for “gravure printing inks” in Eastern Europe from 2022 to 2034 – split by application
Table 72: Demand for “other analog printing inks” in Eastern Europe from 2022 to 2034 – split by application
Table 73: Demand for “inkjet printing inks” in Eastern Europe from 2022 to 2034 – split by application
Table 74: Demand for “toner” in Eastern Europe from 2022 to 2034 – split by application
Table 75: Demand in Eastern Europe from 2022 to 2034 – split by printing ink type
Table 76: Demand in North America from 2022 to 2034 – split by major country
Table77: Revenues generated in North America from 2022 to 2034, in million USD and million EUR
Table 78: Revenues generated in North America from 2022 to 2034 – split by application
Table 79: Production in North America from 2022 to 2034 – split by major country
Table 80: Demand in North America from 2022 to 2034 – split by application
Table 81: Demand in North America from 2022 to 2034 – split by printing process
Table 82: Demand for “heatset printing inks” in North America from 2022 to 2034 – split by application
Table 83: Demand for “coldset printing inks” in North America from 2022 to 2034 – split by application
Table 84: Demand for “sheetfed offset printing inks” in North America from 2022 to 2034 – split by application
Table85: Demand for “flexographic printing inks” in North America from 2022 to 2034 – split by application
Table 86: Demand for “gravure printing inks” in North America from 2022 to 2034 – split by application
Table 87: Demand for “other analog printing inks” in North America from 2022 to 2034 – split by application
Table 88: Demand for “inkjet printing inks” in North America from 2022 to 2034 – split by application
Table 89: Demand for “toner” in North America from 2022 to 2034 – split by application
Table 90: Demand in North America from 2022 to 2034 – split by printing ink type
Table 91: Demand in South America from 2022 to 2034 – split by major country
Table 92: Revenues generated in South America from 2022 to 2034, in million USD and million EUR
Table 93: Revenues generated in South America from 2022 to 2034 – split by application
Table 94: Production in South America from 2022 to 2034 – split by major country
Table 95: Demand in South America from 2022 to 2034 – split by application
Table 96: Demand in South America from 2022 to 2034 – split by printing process
Table 97: Demand for “heatset printing inks” in South America from 2022 to 2034 – split by application
Table 98: Demand for “coldset printing inks” in South America from 2022 to 2034 – split by application
Table 99: Demand for “sheetfed offset printing inks” in South America from 2022 to 2034 – split by application
Table 100: Demand for “flexographic printing inks” in South America from 2022 to 2034 – split by application
Table 101: Demand for “gravure printing inks” in South America from 2022 to 2034 – split by application
Table 102: Demand for “other analog printing inks” in South America from 2022 to 2034 – split by application
Table 103: Demand for “inkjet printing inks” in South America from 2022 to 2034 – split by application
Table 104: Demand for “toner” in South America from 2022 to 2034 – split by application
Table 105: Demand in South America from 2022 to 2034 – split by printing ink type
Table 106: Demand in Asia-Pacific from 2022 to 2034 – split by major country
Table 107: Revenues generated in Asia-Pacific from 2022 to 2034, in million USD and million EUR
Table 108: Revenues generated in Asia-Pacific from 2022 to 2034 – split by application
Table 109: Production in Asia-Pacific from 2022 to 2034 – split by major country
Table 110: Demand in Asia-Pacific from 2022 to 2034 – split by application
Table 111: Demand in Asia-Pacific from 2022 to 2034 – split by printing process
Table 112: Demand for “heatset printing inks” in Asia-Pacific from 2022 to 2034 – split by application
Table 113: Demand for “coldset printing inks” in Asia-Pacific from 2022 to 2034 – split by application
Table 114: Demand for “sheetfed offset printing inks” in Asia-Pacific from 2022 to 2034 – split by application
Table 115: Demand for “flexographic printing inks” in Asia-Pacific from 2022 to 2034 – split by application
Table 116: Demand for “gravure printing inks” in Asia-Pacific from 2022 to 2034 – split by application
Table 117: Demand for “other analog printing inks” in Asia-Pacific from 2022 to 2034 – split by application
Table 118: Demand for “inkjet printing inks” in Asia-Pacific from 2022 to 2034 – split by application
Table 119: Demand for “toner” in Asia-Pacific from 2022 to 2034 – split by application
Table 120: Demand in Asia-Pacific from 2022 to 2034 – split by printing ink type
Table 121: Revenues generated in the Middle East from 2022 to 2034, in million USD and million EUR
Table 122: Revenues generated in the Middle East from 2022 to 2034 – split by application
Table 123: Demand in the Middle East from 2022 to 2034 – split by application
Table 124: Demand in the Middle East from 2022 to 2034 – split by printing process
Table 125: Demand for “heatset printing inks” in the Middle East from 2022 to 2034 – split by application
Table 126: Demand for “coldset printing inks” in the Middle East from 2022 to 2034 – split by application
Table 127: Demand for “sheetfed offset printing inks” in the Middle East from 2022 to 2034 – split by application
Table 128: Demand for “flexographic printing inks” in the Middle East from 2022 to 2034 – split by application
Table 129: Demand for “gravure printing inks” in the Middle East from 2022 to 2034 – split by application
Table 130: Demand for “other analog printing inks” in the Middle East from 2022 to 2034 – split by application
Table 131: Demand for “inkjet printing inks” in the Middle East from 2022 to 2034 – split by application
Table 132: Demand for “toner” in the Middle East from 2022 to 2034 – split by application
Table 133: Demand in the Middle East from 2022 to 2034 – split by printing ink type
Table 134: Revenues generated in Africa from 2022 to 2034, in million USD and million EUR
Table 135: Revenues generated in Africa from 2022 to 2034 – split by application
Table 136: Demand in Africa from 2022 to 2034 – split by application
Table 137: Demand in Africa from 2022 to 2034 – split by printing process
Table 138: Demand for “heatset printing inks” in Africa from 2022 to 2034 – split by application
Table 139: Demand for “coldset printing inks” in Africa from 2022 to 2034 – split by application
Table140: Demand for “sheetfed offset printing inks” in Africa from 2022 to 2034 – split by application
Table 141: Demand for “flexographic printing inks” in Africa from 2022 to 2034 – split by application
Table 142: Demand for “gravure printing inks” in Africa from 2022 to 2034 – split by application
Table 143: Demand for “other analog printing inks” in Africa from 2022 to 2034 – split by application
Table 144: Demand for “inkjet printing inks” in Africa from 2022 to 2034 – split by application
Table 145: Demand for “toner” in Africa from 2022 to 2034 – split by application
Table 146: Demand in Africa from 2022 to 2034 – split by printing ink type
Table 147: Revenues generated in France from 2022 to 2034, in million USD and million EUR
Table 148: Revenues generated in France from 2022 to 2034 – split by application
Table 149: Demand in France from 2022 to 2034 – split by application
Table 150: Demand in France from 2022 to 2034 – split by printing process
Table 151: Demand for “heatset printing inks” in France from 2022 to 2034 – split by application
Table 152: Demand for “coldset printing inks” in France from 2022 to 2034 – split by application
Table 153: Demand for “sheetfed offset printing inks” in France from 2022 to 2034 – split by application
Table154: Demand for “flexographic printing inks” in France from 2022 to 2034 – split by application
Table 155: Demand for “gravure printing inks” in France from 2022 to 2034 – split by application
Table 156: Demand for “other analog printing inks” in France from 2022 to 2034 – split by application
Table 157: Demand for “inkjet printing inks” in France from 2022 to 2034 – split by application
Table 158: Demand for “toner” in France from 2022 to 2034 – split by application
Table 159: Demand in France from 2022 to 2034 – split by printing ink type
Table 160: Production, import, export, and demand in France from 2022 to 2034
Table 161: Revenues generated in Germany from 2022 to 2034, in million USD and million EUR
Table 162: Revenues generated in Germany from 2022 to 2034 – split by application
Table 163: Demand in Germany from 2022 to 2034 – split by application
Table 164: Demand in Germany from 2022 to 2034 – split by printing process
Table 165: Demand for “heatset printing inks” in Germany from 2022 to 2034 – split by application
Table 166: Demand for “coldset printing inks” in Germany from 2022 to 2034 – split by application
Table 167: Demand for “sheetfed offset printing inks” in Germany from 2022 to 2034 – split by application
Table 168: Demand for “flexographic printing inks” in Germany from 2022 to 2034 – split by application
Table 169: Demand for “gravure printing inks” in Germany from 2022 to 2034 – split by application
Table 170: Demand for “other analog printing inks” in Germany from 2022 to 2034 – split by application
Table 171: Demand for “inkjet printing inks” in Germany from 2022 to 2034 – split by application
Table 172: Demand for “toner” in Germany from 2022 to 2034 – split by application
Table 173: Demand in Germany from 2022 to 2034 – split by printing ink type
Table 174: Production, import, export, and demand in Germany from 2022 to 2034
Table 175: Revenues generated in Italy from 2022 to 2034, in million USD and million EUR
Table 176: Revenues generated in Italy from 2022 to 2034 – split by application
Table 177: Demand in Italy from 2022 to 2034 – split by application
Table 178: Demand in Italy from 2022 to 2034 – split by printing process
Table 179: Demand for “heatset printing inks” in Italy from 2022 to 2034 – split by application
Table 180: Demand for “coldset printing inks” in Italy from 2022 to 2034 – split by application
Table 181: Demand for “sheetfed offset printing inks” in Italy from 2022 to 2034 – split by application
Table 182: Demand for “flexographic printing inks” in Italy from 2022 to 2034 – split by application
Table 183: Demand for “gravure printing inks” in Italy from 2022 to 2034 – split by application
Table 184: Demand for “other analog printing inks” in Italy from 2022 to 2034 – split by application
Table 185: Demand for “inkjet printing inks” in Italy from 2022 to 2034 – split by application
Table 186: Demand for “toner” in Italy from 2022 to 2034 – split by application
Table 187: Demand in Italy from 2022 to 2034 – split by printing ink type
Table 188: Production, import, export, and demand in Italy from 2022 to 2034
Table 189: Revenues generated in Spain from 2022 to 2034, in million USD and million EUR
Table 190: Revenues generated in Spain from 2022 to 2034 – split by application
Table 191: Demand in Spain from 2022 to 2034 – split by application
Table 192: Demand in Spain from 2022 to 2034 – split by printing process
Table 193: Demand for “heatset printing inks” in Spain from 2022 to 2034 – split by application
Table 194: Demand for “coldset printing inks” in Spain from 2022 to 2034 – split by application
Table 195: Demand for “sheetfed offset printing inks” in Spain from 2022 to 2034 – split by application
Table 196: Demand for “flexographic printing inks” in Spain from 2022 to 2034 – split by application
Table 197: Demand for “gravure printing inks” in Spain from 2022 to 2034 – split by application
Table 198: Demand for “other analog printing inks” in Spain from 2022 to 2034 – split by application
Table 199: Demand for “inkjet printing inks” in Spain from 2022 to 2034 – split by application
Table 200: Demand for “toner” in Spain from 2022 to 2034 – split by application
Table 201: Demand in Spain from 2022 to 2034 – split by printing ink type
Table 202: Production, import, export, and demand in Spain from 2022 to 2034
Table 203: Revenues generated in the Netherlands from 2022 to 2034, in million USD and million EUR
Table 204: Revenues generated in the Netherlands from 2022 to 2034 – split by application
Table 205: Demand in the Netherlands from 2022 to 2034 – split by application
Table 206: Demand in the Netherlands from 2022 to 2034 – split by printing process
Table 207: Demand for “heatset printing inks” in the Netherlands from 2022 to 2034 – split by application
Table 208: Demand for “coldset printing inks” in the Netherlands from 2022 to 2034 – split by application
Table 209: Demand for “sheetfed offset printing inks” in the Netherlands from 2022 to 2034 – split by application
Table 210: Demand for “flexographic printing inks” in the Netherlands from 2022 to 2034 – split by application
Table 211: Demand for “gravure printing inks” in the Netherlands from 2022 to 2034 – split by application
Table 212: Demand for “other analog printing inks” in the Netherlands from 2022 to 2034 – split by application
Table 213: Demand for “inkjet printing inks” in the Netherlands from 2022 to 2034 – split by application
Table 214: Demand for “toner” in the Netherlands from 2022 to 2034 – split by application
Table 215: Demand in the Netherlands from 2022 to 2034 – split by printing ink type
Table 216: Production, import, export, and demand in the Netherlands from 2022 to 2034
Table 217: Revenues generated in the United Kingdom from 2022 to 2034, in million USD and million EUR
Table 218: Revenues generated in the United Kingdom from 2022 to 2034 – split by application
Table 219: Demand in the United Kingdom from 2022 to 2034 – split by application
Table 220: Demand in the United Kingdom from 2022 to 2034 – split by printing process
Table 221: Demand for “heatset printing inks” in the United Kingdom from 2022 to 2034 – split by application
Table 222: Demand for “coldset printing inks” in the United Kingdom from 2022 to 2034 – split by application
Table 223: Demand for “sheetfed offset printing inks” in the United Kingdom from 2022 to 2034 – split by application
Table 224: Demand for “flexographic printing inks” in the United Kingdom from 2022 to 2034 – split by application
Table 225: Demand for “gravure printing inks” in the United Kingdom from 2022 to 2034 – split by application
Table 226: Demand for “other analog printing inks” in the United Kingdom from 2022 to 2034 – split by application
Table 227: Demand for “inkjet printing inks” in the United Kingdom from 2022 to 2034 – split by application
Table 228: Demand for “toner” in the United Kingdom from 2022 to 2034 – split by application
Table 229: Demand in the United Kingdom from 2022 to 2034 – split by printing ink type
Table 230: Production, import, export, and demand in the United Kingdom from 2022 to 2034
Table 231: Revenues generated in Other Western Europe from 2022 to 2034, in million USD and million EUR
Table 232: Revenues generated in Other Western Europe from 2022 to 2034 – split by application
Table 233: Demand in Other Western Europe from 2022 to 2034 – split by application
Table 234: Demand in Other Western Europe from 2022 to 2034 – split by printing process
Table 235: Demand for “heatset printing inks” in Other Western Europe from 2022 to 2034 – split by application
Table 236: Demand for “coldset printing inks” in Other Western Europe from 2022 to 2034 – split by application
Table 237: Demand for “sheetfed offset printing inks” in Other Western Europe from 2022 to 2034 – split by application
Table 238: Demand for “flexographic printing inks” in Other Western Europe from 2022 to 2034 – split by application
Table 239: Demand for “gravure printing inks” in Other Western Europe from 2022 to 2034 – split by application
Table 240: Demand for “other analog printing inks” in Other Western Europe from 2022 to 2034 – split by application
Table 241: Demand for “inkjet printing inks” in Other Western Europe from 2022 to 2034 – split by application
Table 242: Demand for “toner” in Other Western Europe from 2022 to 2034 – split by application
Table 243: Demand in Other Western Europe from 2022 to 2034 – split by printing ink type
Table 244: Production, import, export, and demand in Other Western Europe from 2022 to 2034
Table 245: Revenues generated in Poland from 2022 to 2034, in million USD and million EUR
Table 246: Revenues generated in Poland from 2022 to 2034 – split by application
Table 247: Demand in Poland from 2022 to 2034 – split by application
Table 248: Demand in Poland from 2022 to 2034 – split by printing process
Table 249: Demand for “heatset printing inks” in Poland from 2022 to 2034 – split by application
Table 250: Demand for “coldset printing inks” in Poland from 2022 to 2034 – split by application
Table 251: Demand for “sheetfed offset printing inks” in Poland from 2022 to 2034 – split by application
Table 252: Demand for “flexographic printing inks” in Poland from 2022 to 2034 – split by application
Table 253: Demand for “gravure printing inks” in Poland from 2022 to 2034 – split by application
Table 254: Demand for “other analog printing inks” in Poland from 2022 to 2034 – split by application
Table 255: Demand for “inkjet printing inks” in Poland from 2022 to 2034 – split by application
Table 256: Demand for “toner” in Poland from 2022 to 2034 – split by application
Table 257: Demand in Poland from 2022 to 2034 – split by printing ink type
Table 258: Production, import, export, and demand in Poland from 2022 to 2034
Table 259: Revenues generated in Russia from 2022 to 2034, in million USD and million EUR
Table 260: Revenues generated in Russia from 2022 to 2034 – split by application
Table 261: Demand in Russia from 2022 to 2034 – split by application
Table 262: Demand in Russia from 2022 to 2034 – split by printing process
Table 263: Demand for “heatset printing inks” in Russia from 2022 to 2034 – split by application
Table 264: Demand for “coldset printing inks” in Russia from 2022 to 2034 – split by application
Table 265: Demand for “sheetfed offset printing inks” in Russia from 2022 to 2034 – split by application
Table 266: Demand for “flexographic printing inks” in Russia from 2022 to 2034 – split by application
Table 267: Demand for “gravure printing inks” in Russia from 2022 to 2034 – split by application
Table 268: Demand for “other analog printing inks” in Russia from 2022 to 2034 – split by application
Table 269: Demand for “inkjet printing inks” in Russia from 2022 to 2034 – split by application
Table 270: Demand for “toner” in Russia from 2022 to 2034 – split by application
Table 271: Demand in Russia from 2022 to 2034 – split by printing ink type
Table 272: Production, import, export, and demand in Russia from 2022 to 2034
Table 273: Revenues generated in Türkiye from 2022 to 2034, in million USD and million EUR
Table 274: Revenues generated in Türkiye from 2022 to 2034 – split by application
Table 275: Demand in Türkiye from 2022 to 2034 – split by application
Table 276: Demand in Türkiye from 2022 to 2034 – split by printing process
Table 277: Demand for “heatset printing inks” in Türkiye from 2022 to 2034 – split by application
Table 278: Demand for “coldset printing inks” in Türkiye from 2022 to 2034 – split by application
Table 279: Demand for “sheetfed offset printing inks” in Türkiye from 2022 to 2034 – split by application
Table 280: Demand for “flexographic printing inks” in Türkiye from 2022 to 2034 – split by application
Table 281: Demand for “gravure printing inks” in Türkiye from 2022 to 2034 – split by application
Table 282: Demand for “other analog printing inks” in Türkiye from 2022 to 2034 – split by application
Table 283: Demand for “inkjet printing inks” in Türkiye from 2022 to 2034 – split by application
Table 284: Demand for “toner” in Türkiye from 2022 to 2034 – split by application
Table 285: Demand in Türkiye from 2022 to 2034 – split by printing ink type
Table 286: Production, import, export, and demand in Türkiye from 2022 to 2034
Table 287: Revenues generated in Other Eastern Europe from 2022 to 2034, in million USD and million EUR
Table 288: Revenues generated in Other Eastern Europe from 2022 to 2034 – split by application
Table 289: Demand in Other Eastern Europe from 2022 to 2034 – split by application
Table 290: Demand in Other Eastern Europe from 2022 to 2034 – split by printing process
Table 291: Demand for “heatset printing inks” in Other Eastern Europe from 2022 to 2034 – split by application
Table 292: Demand for “coldset printing inks” in Other Eastern Europe from 2022 to 2034 – split by application
Table 293: Demand for “sheetfed offset printing inks” in Other Eastern Europe from 2022 to 2034 – split by application
Table 294: Demand for “flexographic printing inks” in Other Eastern Europe from 2022 to 2034 – split by application
Table 295: Demand for “gravure printing inks” in Other Eastern Europe from 2022 to 2034 – split by application
Table 296: Demand for “other analog printing inks” in Other Eastern Europe from 2022 to 2034 – split by application
Table 297: Demand for “inkjet printing inks” in Other Eastern Europe from 2022 to 2034 – split by application
Table 298: Demand for “toner” in Other Eastern Europe from 2022 to 2034 – split by application
Table 299: Demand in Other Eastern Europe from 2022 to 2034 – split by printing ink type
Table 300: Production, import, export, and demand in Other Eastern Europe from 2022 to 2034
Table 301: Revenues generated in Canada from 2022 to 2034, in million USD and million EUR
Table 302: Revenues generated in Canada from 2022 to 2034 – split by application
Table 303: Demand in Canada from 2022 to 2034 – split by application
Table 304: Demand in Canada from 2022 to 2034 – split by printing process
Table 305: Demand for “heatset printing inks” in Canada from 2022 to 2034 – split by application
Table 306: Demand for “coldset printing inks” in Canada from 2022 to 2034 – split by application
Table 307: Demand for “sheetfed offset printing inks” in Canada from 2022 to 2034 – split by application
Table 308: Demand for “flexographic printing inks” in Canada from 2022 to 2034 – split by application
Table 309: Demand for “gravure printing inks” in Canada from 2022 to 2034 – split by application
Table 310: Demand for “other analog printing inks” in Canada from 2022 to 2034 – split by application
Table 311: Demand for “inkjet printing inks” in Canada from 2022 to 2034 – split by application
Table 312: Demand for “toner” in Canada from 2022 to 2034 – split by application
Table 313: Demand in Canada from 2022 to 2034 – split by printing ink type
Table 314: Production, import, export, and demand in Canada from 2022 to 2034
Table 315: Revenues generated in Mexico from 2022 to 2034, in million USD and million EUR
Table 316: Revenues generated in Mexico from 2022 to 2034 – split by application
Table 317: Demand in Mexico from 2022 to 2034 – split by application
Table 318: Demand in Mexico from 2022 to 2034 – split by printing process
Table 319: Demand for “heatset printing inks” in Mexico from 2022 to 2034 – split by application
Table 320: Demand for “coldset printing inks” in Mexico from 2022 to 2034 – split by application
Table 321: Demand for “sheetfed offset printing inks” in Mexico from 2022 to 2034 – split by application
Table 322: Demand for “flexographic printing inks” in Mexico from 2022 to 2034 – split by application
Table 323: Demand for “gravure printing inks” in Mexico from 2022 to 2034 – split by application
Table 324: Demand for “other analog printing inks” in Mexico from 2022 to 2034 – split by application
Table 325: Demand for “inkjet printing inks” in Mexico from 2022 to 2034 – split by application
Table 326: Demand for “toner” in Mexico from 2022 to 2034 – split by application
Table 327: Demand in Mexico from 2022 to 2034 – split by printing ink type
Table 328: Production, import, export, and demand in Mexico from 2022 to 2034
Table 329: Revenues generated in the USA from 2022 to 2034, in million USD and million EUR
Table 330: Revenues generated in the USA from 2022 to 2034 – split by application
Table 331: Demand in the USA from 2022 to 2034 – split by application
Table 332: Demand in the USA from 2022 to 2034 – split by printing process
Table 333: Demand for “heatset printing inks” in the USA from 2022 to 2034 – split by application
Table 334: Demand for “coldset printing inks” in the USA from 2022 to 2034 – split by application
Table 335: Demand for “sheetfed offset printing inks” in the USA from 2022 to 2034 – split by application
Table 336: Demand for “flexographic printing inks” in the USA from 2022 to 2034 – split by application
Table 337: Demand for “gravure printing inks” in the USA from 2022 to 2034 – split by application
Table 338: Demand for “other analog printing inks” in the USA from 2022 to 2034 – split by application
Table 339: Demand for “inkjet printing inks” in the USA from 2022 to 2034 – split by application
Table 340: Demand for “toner” in the USA from 2022 to 2034 – split by application
Table 341: Demand in the USA from 2022 to 2034 – split by printing ink type
Table 342: Production, import, export, and demand in the USA from 2022 to 2034
Table 343: Revenues generated in Brazil from 2022 to 2034, in million USD and million EUR
Table 344: Revenues generated in Brazil from 2022 to 2034 – split by application
Table345: Demand in Brazil from 2022 to 2034 – split by application
Table346: Demand in Brazil from 2022 to 2034 – split by printing process
Table 347: Demand for “heatset printing inks” in Brazil from 2022 to 2034 – split by application
Table 348: Demand for “coldset printing inks” in Brazil from 2022 to 2034 – split by application
Table 349: Demand for “sheetfed offset printing inks” in Brazil from 2022 to 2034 – split by application
Table 350: Demand for “flexographic printing inks” in Brazil from 2022 to 2034 – split by application
Table 351: Demand for “gravure printing inks” in Brazil from 2022 to 2034 – split by application
Table 352: Demand for “other analog printing inks” in Brazil from 2022 to 2034 – split by application
Table 353: Demand for “inkjet printing inks” in Brazil from 2022 to 2034 – split by application
Table 354: Demand for “toner” in Brazil from 2022 to 2034 – split by application
Table355: Demand in Brazil from 2022 to 2034 – split by printing ink type
Table356: Production, import, export, and demand in Brazil from 2022 to 2034
Table 357: Revenues generated in Other South America from 2022 to 2034, in million USD and million EUR
Table 358: Revenues generated in Other South America from 2022 to 2034 – split by application
Table 359: Demand in Other South America from 2022 to 2034 – split by application
Table 360: Demand in Other South America from 2022 to 2034 – split by printing process
Table 361: Demand for “heatset printing inks” in Other South America from 2022 to 2034 – split by application
Table 362: Demand for “coldset printing inks” in Other South America from 2022 to 2034 – split by application
Table 363: Demand for “sheetfed offset printing inks” in Other South America from 2022 to 2034 – split by application
Table 364: Demand for “flexographic printing inks” in Other South America from 2022 to 2034 – split by application
Table 365: Demand for “gravure printing inks” in Other South America from 2022 to 2034 – split by application
Table 366: Demand for “other analog printing inks” in Other South America from 2022 to 2034 – split by application
Table 367: Demand for “inkjet printing inks” in Other South America from 2022 to 2034 – split by application
Table 368: Demand for “toner” in Other South America from 2022 to 2034 – split by application
Table 369: Demand in Other South America from 2022 to 2034 – split by printing ink type
Table 370: Production, import, export, and demand in Other South America from 2022 to 2034
Table 371: Revenues generated in China from 2022 to 2034, in million USD and million EUR
Table 372: Revenues generated in China from 2022 to 2034 – split by application
Table 373: Demand in China from 2022 to 2034 – split by application
Table 374: Demand in China from 2022 to 2034 – split by printing process
Table 375: Demand for “heatset printing inks” in China from 2022 to 2034 – split by application
Table 376: Demand for “coldset printing inks” in China from 2022 to 2034 – split by application
Table 377: Demand for “sheetfed offset printing inks” in China from 2022 to 2034 – split by application
Table 378: Demand for “flexographic printing inks” in China from 2022 to 2034 – split by application
Table 379: Demand for “gravure printing inks” in China from 2022 to 2034 – split by application
Table 380: Demand for “other analog printing inks” in China from 2022 to 2034 – split by application
Table 381: Demand for “inkjet printing inks” in China from 2022 to 2034 – split by application
Table 382: Demand for “toner” in China from 2022 to 2034 – split by application
Table 383: Demand in China from 2022 to 2034 – split by printing ink type
Table 384: Production, import, export, and demand in China from 2022 to 2034
Table 385: Revenues generated in India from 2022 to 2034, in million USD and million EUR
Table 386: Revenues generated in India from 2022 to 2034 – split by application
Table 387: Demand in India from 2022 to 2034 – split by application
Table 388: Demand in India from 2022 to 2034 – split by printing process
Table 389: Demand for “heatset printing inks” in India from 2022 to 2034 – split by application
Table 390: Demand for “coldset printing inks” in India from 2022 to 2034 – split by application
Table 391: Demand for “sheetfed offset printing inks” in India from 2022 to 2034 – split by application
Table 392: Demand for “flexographic printing inks” in India from 2022 to 2034 – split by application
Table 393: Demand for “gravure printing inks” in India from 2022 to 2034 – split by application
Table 394: Demand for “other analog printing inks” in India from 2022 to 2034 – split by application
Table 395: Demand for “inkjet printing inks” in India from 2022 to 2034 – split by application
Table 396: Demand for “toner” in India from 2022 to 2034 – split by application
Table 397: Demand in India from 2022 to 2034 – split by printing ink type
Table 398: Production, import, export, and demand in India from 2022 to 2034
Table 399: Revenues generated in Japan from 2022 to 2034, in million USD and million EUR
Table 400: Revenues generated in Japan from 2022 to 2034 – split by application
Table 401: Demand in Japan from 2022 to 2034 – split by application
Table 402: Demand in Japan from 2022 to 2034 – split by printing process
Table 403: Demand for “heatset printing inks” in Japan from 2022 to 2034 – split by application
Table 404: Demand for “coldset printing inks” in Japan from 2022 to 2034 – split by application
Table 405: Demand for “sheetfed offset printing inks” in Japan from 2022 to 2034 – split by application
Table 406: Demand for “flexographic printing inks” in Japan from 2022 to 2034 – split by application
Table 407: Demand for “gravure printing inks” in Japan from 2022 to 2034 – split by application
Table 408: Demand for “other analog printing inks” in Japan from 2022 to 2034 – split by application
Table 409: Demand for “inkjet printing inks” in Japan from 2022 to 2034 – split by application
Table 410: Demand for “toner” in Japan from 2022 to 2034 – split by application
Table 411: Demand in Japan from 2022 to 2034 – split by printing ink type
Table 412: Production, import, export, and demand in Japan from 2022 to 2034
Table 413: Revenues generated in South Korea from 2022 to 2034, in million USD and million EUR
Table 414: Revenues generated in South Korea from 2022 to 2034 – split by application
Table 415: Demand in South Korea from 2022 to 2034 – split by application
Table 416: Demand in South Korea from 2022 to 2034 – split by printing process
Table 417: Demand for “heatset printing inks” in South Korea from 2022 to 2034 – split by application
Table 418: Demand for “coldset printing inks” in South Korea from 2022 to 2034 – split by application
Table 419: Demand for “sheetfed offset printing inks” in South Korea from 2022 to 2034 – split by application
Table 420: Demand for “flexographic printing inks” in South Korea from 2022 to 2034 – split by application
Table 421: Demand for “gravure printing inks” in South Korea from 2022 to 2034 – split by application
Table 422: Demand for “other analog printing inks” in South Korea from 2022 to 2034 – split by application
Table 423: Demand for “inkjet printing inks” in South Korea from 2022 to 2034 – split by application
Table 424: Demand for “toner” in South Korea from 2022 to 2034 – split by application
Table 425: Demand in South Korea from 2022 to 2034 – split by printing ink type
Table 426: Production, import, export, and demand in South Korea from 2022 to 2034
Table 427: Revenues generated in Other Asia-Pacific from 2022 to 2034, in million USD and million EUR
Table 428: Revenues generated in Other Asia-Pacific from 2022 to 2034 – split by application
Table 429: Demand in Other Asia-Pacific from 2022 to 2034 – split by application
Table 430: Demand in Other Asia-Pacific from 2022 to 2034 – split by printing process
Table 431: Demand for “heatset printing inks” in Other Asia-Pacific from 2022 to 2034 – split by application
Table 432: Demand for “coldset printing inks” in Other Asia-Pacific from 2022 to 2034 – split by application
Table 433: Demand for “sheetfed offset printing inks” in Other Asia-Pacific from 2022 to 2034 – split by application
Table 434: Demand for “flexographic printing inks” in Other Asia-Pacific from 2022 to 2034 – split by application
Table 435: Demand for “gravure printing inks” in Other Asia-Pacific from 2022 to 2034 – split by application
Table 436: Demand for “other analog printing inks” in Other Asia-Pacific from 2022 to 2034 – split by application
Table 437: Demand for “inkjet printing inks” in Other Asia-Pacific from 2022 to 2034 – split by application
Table 438: Demand for “toner” in Other Asia-Pacific from 2022 to 2034 – split by application
Table 439: Demand in Other Asia-Pacific from 2022 to 2034 – split by printing ink type
Table 440: Production, import, export, and demand in Other Asia-Pacific from 2022 to 2034


