

Description
The Paints and Coatings Market Report – Europe is now also available in parts (e.g. individual country profiles or all manufacturer profiles). Please feel free to contact us and we will immediately send you an offer for your specific selection.
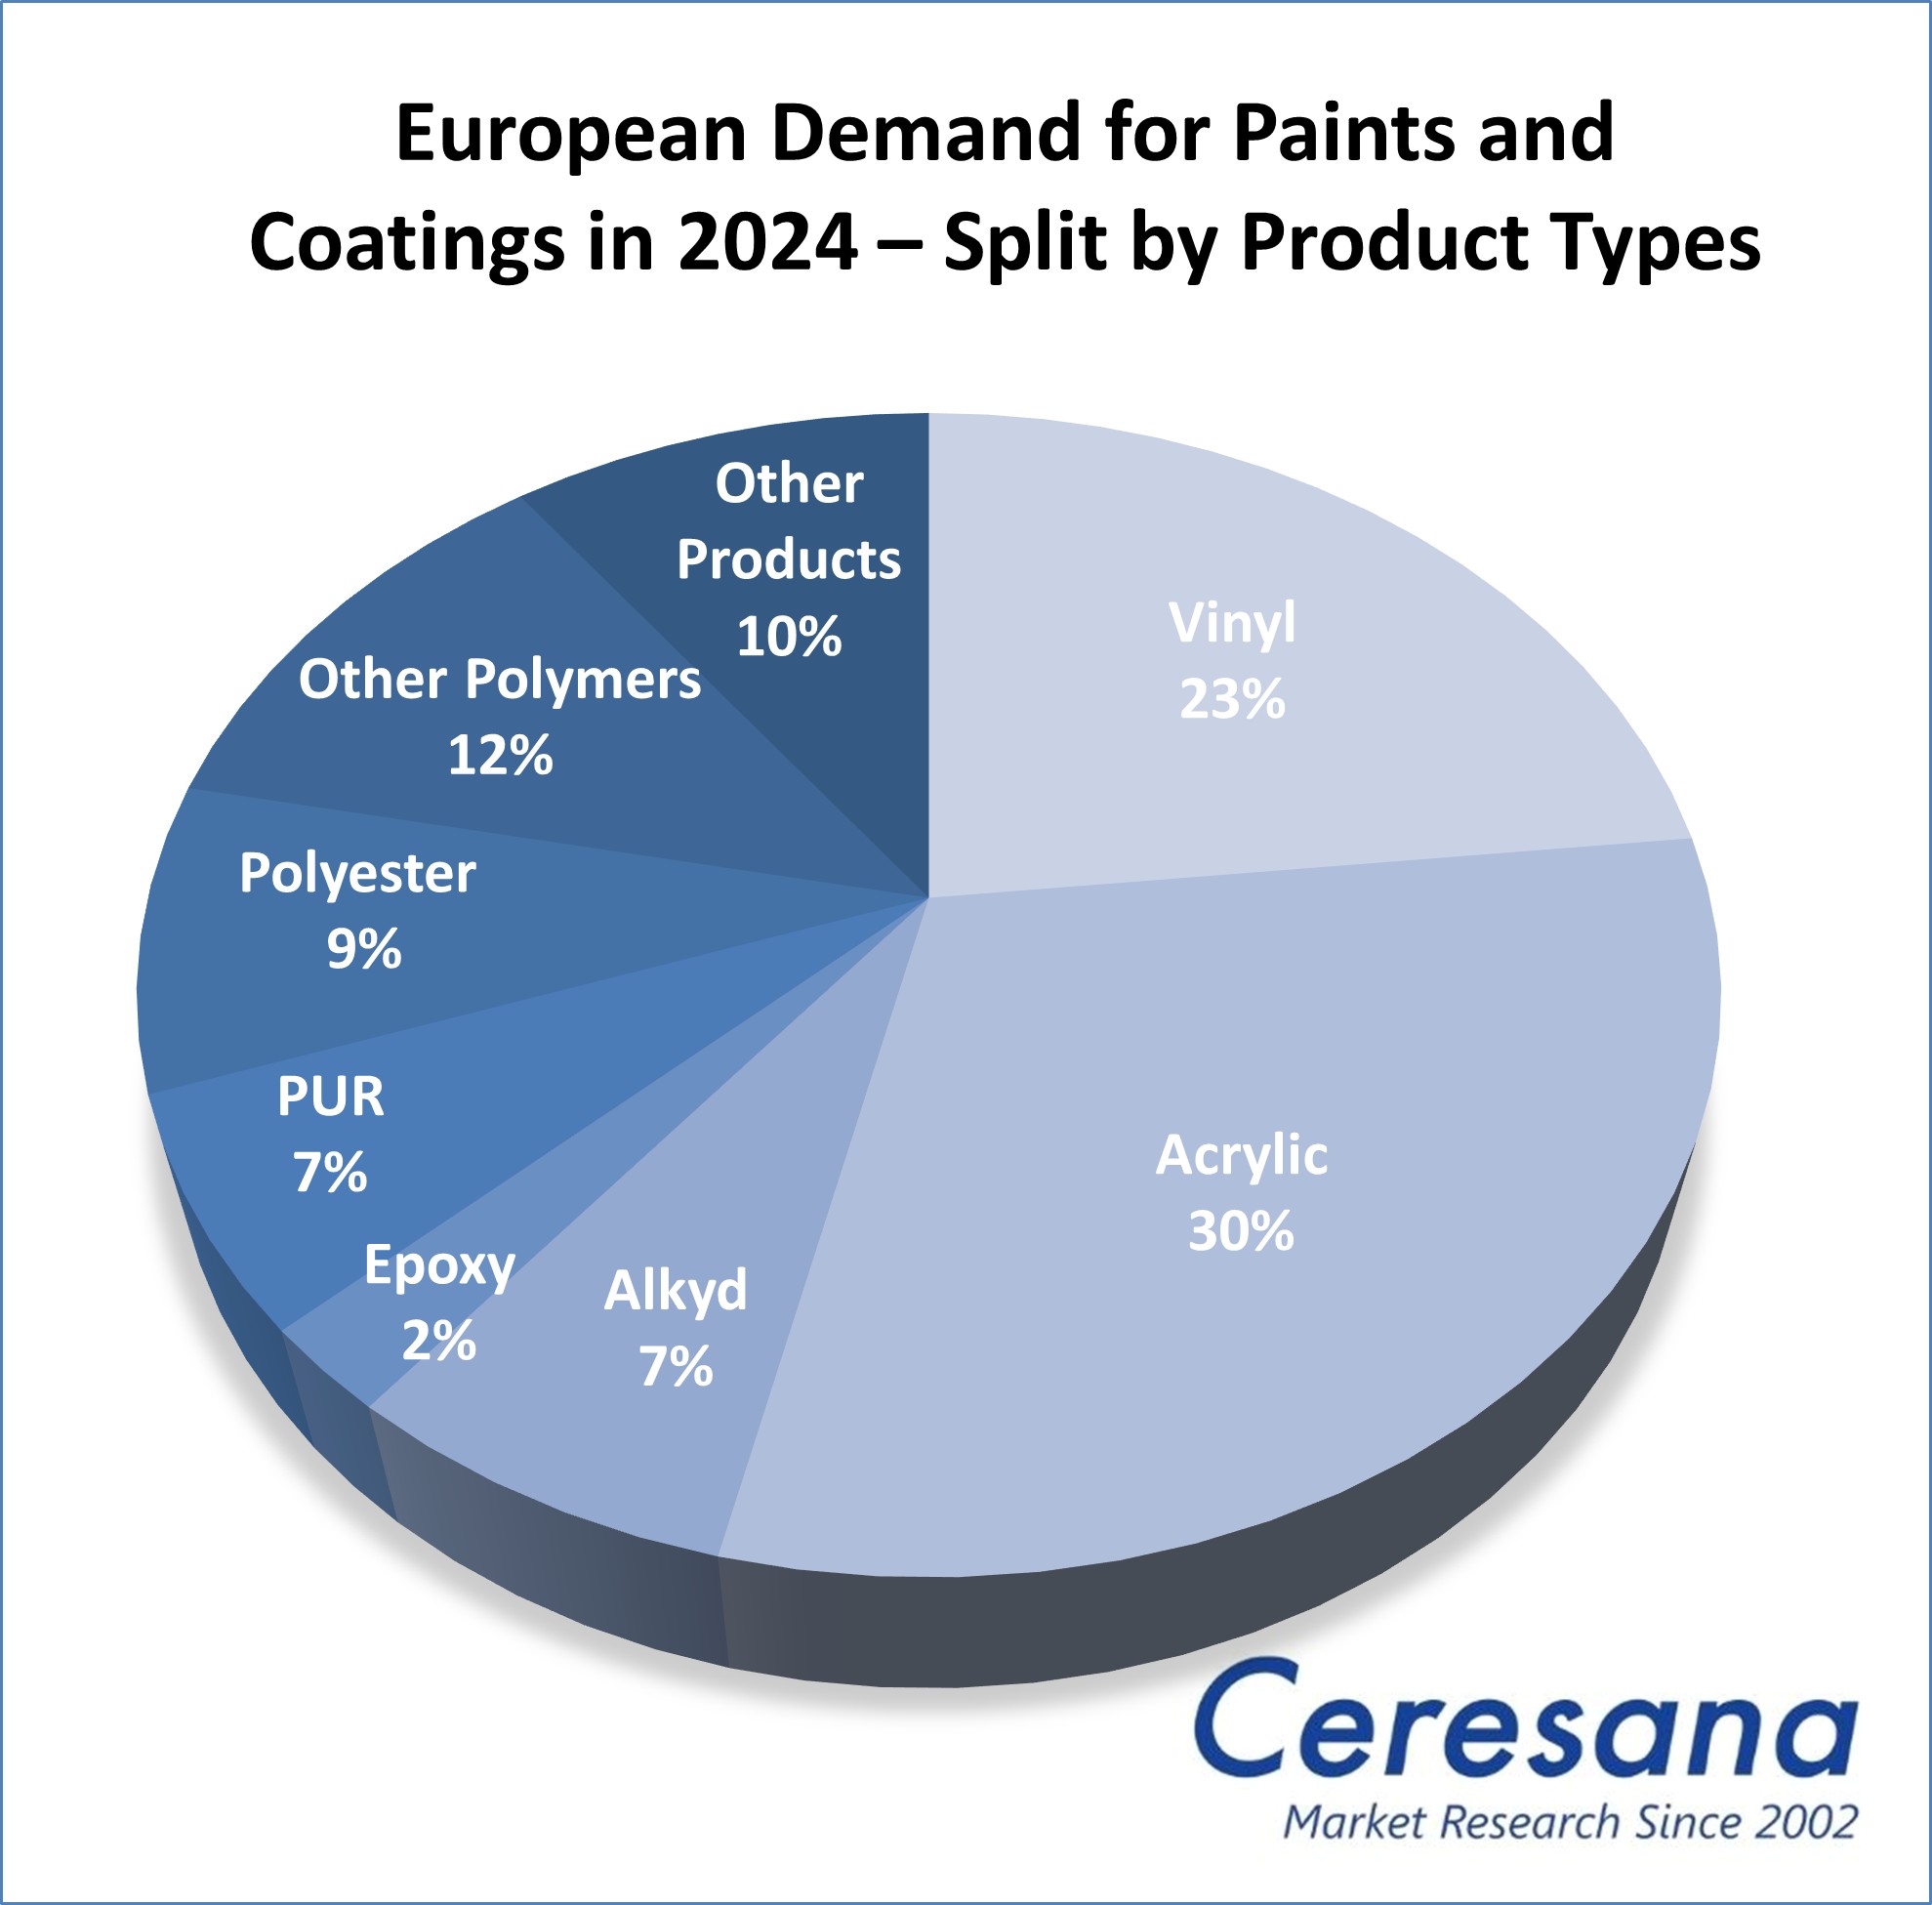
From niche products to everyday standard in a short space of time: Acrylic and polyester-based paints and coatings are currently experiencing the greatest growth in Europe. Acrylics dominate in water-based dispersions, polyesters in powder coatings – as low-emission and more environmentally friendly alternatives to solvent-based paints, both benefit from the trend towards sustainability and from EU regulations. However, the latest, seventh edition of the Ceresana market study “Paints and Coatings – Europe” shows that not only plastics such as epoxy or polyurethane (PUR) are on the rise: Increasingly, bio-based coatings are also being used, which can be easily combined with bio-based insulation materials, bio-based adhesives, and other construction materials made from renewable raw materials. In total, Europeans consume around 9.1 million tonnes of paints and coatings per year.
Repairs for Vehicles and Infrastructure
The construction sector is the largest paints application area in Europe. Almost two thirds of all paints and coatings are purchased by the construction industry: Facade paints and interior wall paints for residential construction, but also architectural paints for commercial construction and infrastructure projects. High interest rates, rising construction costs, and weak demand for new residential construction are casting a shadow over the future market development. However, due to a high need for renovation, stricter energy efficiency requirements, extensive government subsidies for energy-efficient renovations, and the expansion of infrastructure, Ceresana’s market researchers expect demand for paints and coatings in the construction sector to increase by around 2.0% per year until 2034. In contrast, only below-average growth is forecast for industrial goods, the second largest area of application for paints and coatings: A weak economy in the EU, customs conflicts, and uncertainties in global supply chains are slowing demand for industrial paint. At least there is momentum from investments in renewable energies and infrastructure projects. The stable refinish sector in the transportation industry ensures an optimistic outlook for automotive paint: The growing vehicle fleet and higher consumer expectations are increasing the demand for refinishing.
Industry Analyses for Coatings
The current edition of Ceresana’s European paints and coatings market study presents all information and forecasts on production, demand, import, and export as well as revenues for the years 2022 to 2034 in clearly arranged tables. The market report examines the demand per product type: from paints and coatings based on acrylics, vinyl, alkyd, epoxy, polyurethane (PUR), and polyester to products based on other base materials. In addition to market data and forecasts, the study also contains background information on the regulatory framework in the EU as well as the general economic situation and the situation in the construction industry (including important companies, construction activities, investments, planned construction projects) in the individual countries. Not included in this study are other coating materials such as mortar, plaster, diluter, printing ink, textile dyes, and food coloring.
Current 7th Edition of the European Paints and Coatings Market Study:
Chapter 1 provides a comprehensive analysis of the European paints and coatings industry – including forecasts up to 2034: The development of production and demand (both in tonnes) and revenues (in dollars and euros) is clearly illustrated.
The application areas of paints and coatings are considered individually, both in terms of demand in tonnes and revenues in euros. A distinction is made between the following areas:
- Construction
- Industry (coil coating, others)
- Transportation (OEM, refinish coatings, marine coatings)
- Wood processing
- Other applications
The application area “construction” is additionally subdivided into the various construction segments:
- New Construction
- Renovation
- Residential
- Non-Residential
The demand for paints and coatings is also analyzed for the various product types:
- Vinyl paints
- Acrylic paints
- Alkyd paints
- Epoxy paints
- Polyurethane paints (PUR)
- Polyester paints
- Paints based on other polymers
- Other paints and coatings
Lastly, the study also breaks down the market data for the various technologies:
- Water-based paints and coatings
- Solvent-based paints and coatings
- Powder coatings
- Other technologies
In Chapter 2, 23 European sales markets for coating materials are examined individually: Austria, Belgium, Czechia, Denmark, Finland, France, Germany, Greece, Hungary, Italy, Norway, Poland, Portugal, Romania, Russia, Slovakia, Slovenia, Spain, Sweden, Switzerland, the Netherlands, Türkiye, and the UK.
The following are shown in each case: Production, demand, revenues, and trade of paints and coatings. The demand is shown for 5 application areas, 8 product types, and 4 technologies in this chapter as well. Revenues are also broken down by application area. In addition, the “construction” application area is also divided into 4 construction segments at country level.
Chapter 3 provides company profiles of the largest European paints and coatings manufacturers, clearly arranged according to contact details, revenues, net income, product range, production sites, and short overview of the company. Detailed profiles of 70 coatings and paints manufacturers are provided, such as of AkzoNobel N.V., ALTANA AG, BASF Coatings GmbH, Dyo Boya Fabrikalari Sanayi ve Ticaret A.Ş., Hempel AS, PPG Industries Europe Sàrl, and Sherwin-Williams Sweden AB.
=> Ceresana regularly analyzes the European and global markets for paints and coatings. For example, new Ceresana studies specifically analyze the markets for bio-based paints and coatings. In addition, Ceresana market reports are available on various coating ingredients, such as solvents, pigments, surfactants, and fillers. Current Ceresana market analyses on individual construction products, such as windows and doors, insulation materials, plastic pipes, plastic films, and adhesives, are also relevant for the construction industry and other coatings consumers. Printing inks are dealt with in separate Ceresana studies. Bio-based materials are a particular focus of Ceresana’s market research. Ceresana also organizes online events on the bio-economy, for example on bio-based adhesives and bio-based paints and coatings.
Scope of the Report:
Attributes | Details |
| Base Year | 2024 |
| Trend Period | 2022 – 2034 |
| Forecast Period | 2025 – 2034 |
| Pages | 410 |
| Application Areas | Construction, industry, transportation, wood processing, other applications |
| Product Type | Vinyl, acrylics, alkyd, epoxy, PUR, polyester, other polymers, other products |
| Technologies | Water-based, solvent-based, powder coatings, and others |
| Company Profiles | AkzoNobel, ALTANA, BASF Coatings, Dyo Boya, Hempel, PPG, and Sherwin-Williams (Selection) |
| Edition | 7th edition |
| Publication | December 2025 |
FAQs
What was the Europe-wide usage of paints and coatings in 2024?
9.1 million tonnes of paints and coatings were utilized in 2024.
What is the largest application area of paints and coatings?
The construction sector is the largest paints application area in Europe.
Which area of application for paints and coatings has the highest growth?
Ceresana market researchers predict that demand for paints and coatings in the construction sector will increase by around 2.0% per year until 2034.
1 Market Data: Europe
1.1 Demand
1.2 Revenues
1.3 Production
1.4 Demand Split by Application Area
1.4.1 Construction
1.4.2 Industry
1.4.3 Transportation
1.4.4 Wood Processing
1.4.5 Other Applications
1.5 Revenues Split by Application Area
1.5.1 Construction
1.5.2 Industry
1.5.3 Transportation
1.5.4 Wood Processing
1.5.5 Other Applications
1.6 Demand Split by Construction Segment
1.6.1 New Construction
1.6.2 Renovation
1.6.3 Residential Construction
1.6.4 Non-Residential Construction
1.7 Demand Split by Product
1.7.1 Vinyl Paints
1.7.2 Acrylic Paints
1.7.3 Alkyd Paints
1.7.4 Epoxy Paints
1.7.5 Polyurethane Paints
1.7.6 Polyester Paints
1.7.7 Paints Based on Other Polymers
1.7.8 Other Products
1.8 Demand Split by Technology
1.8.1 Water-Based Paints and Coatings
1.8.2 Solvent-Based Paints and Coatings
1.8.3 Powder Coatings
1.8.4 Other Technologies
1.9 Excursus: Bio-Based Paints and Coatings
1.10 Excursus: Regulations and Directives in the European Union (EU)
1.10.1 General Information
1.10.2 Construction
2 Market Data: Countries
2.1 Austria
2.1.1 Demand and Revenues
2.1.2 Production and Trade
2.2 Belgium
2.2.1 Demand and Revenues
2.2.2 Production and Trade
2.3 Czechia
2.3.1 Demand and Revenues
2.3.2 Production and Trade
2.4 Denmark
2.4.1 Demand and Revenues
2.4.2 Production and Trade
2.5 Finland
2.5.1 Demand and Revenues
2.5.2 Production and Trade
2.6 France
2.6.1 Demand and Revenues
2.6.2 Production and Trade
2.7 Germany
2.7.1 Demand and Revenues
2.7.2 Production and Trade
2.8 Greece
2.8.1 Demand and Revenues
2.8.2 Production and Trade
2.9 Hungary
2.9.1 Demand and Revenues
2.9.2 Production and Trade
2.10 Italy
2.10.1 Demand and Revenues
2.10.2 Production and Trade
2.11 Norway
2.11.1 Demand and Revenues
2.11.2 Production and Trade
2.12 Poland
2.12.1 Demand and Revenues
2.12.2 Production and Trade
2.13 Portugal
2.13.1 Demand and Revenues
2.13.2 Production and Trade
2.14 Romania
2.14.1 Demand and Revenues
2.14.2 Production and Trade
2.15 Russia
2.15.1 Demand and Revenues
2.15.2 Production and Trade
2.16 Slovakia
2.16.1 Demand and Revenues
2.16.2 Production and Trade
2.17 Slovenia
2.17.1 Demand and Revenues
2.17.2 Production and Trade
2.18 Spain
2.18.1 Demand and Revenues
2.18.2 Production and Trade
2.19 Sweden
2.19.1 Demand and Revenues
2.19.2 Production and Trade
2.20 Switzerland
2.20.1 Demand and Revenues
2.20.2 Production and Trade
2.21 The Netherlands
2.21.1 Demand and Revenues
2.21.2 Production and Trade
2.22 Türkiye
2.22.1 Demand and Revenues
2.22.2 Production and Trade
2.23 United Kingdom
2.23.1 Demand and Revenues
2.23.2 Production and Trade
2.24 Rest of Europe
2.24.1 Demand and Revenues
2.24.2 Production and Trade
3 Company Profiles*
Austria (4 producers)
Belgium (1)
Czechia (1)
Denmark (2)
Finland (1)
France (4)
Germany (22)
Greece (2)
Italy (5)
Norway (1)
Poland (1)
Portugal (1)
Romania (2)
Russia (2)
Slovenia (1)
Spain (3)
Sweden (2)
Switzerland (6)
The Netherlands (4)
Türkiye (4)
United Kingdom (1)
*Note: The profiles are assigned to the country in which the company or holding is headquartered. Profiles also include JVs and subsidiaries.
Graph 1: Demand in Europe from 2022 to 2034
Graph 2: Revenues generated in Europe from 2022 to 2034, in billion USD and billion EUR
Graph 3: Production in Europe from 2022 to 2034
Graph 4: Demand for biobased paints and coatings in Europe (2024) – split by application
Graph 5: Demand in Austria from 2022 to 2034
Graph 6: Production in Austria from 2022 to 2034
Graph 7: Demand in Belgium from 2022 to 2034
Graph 8: Production in Belgium from 2022 to 2034
Graph 9: Demand in Czechia from 2022 to 2034
Graph 10: Production in Czechia from 2022 to 2034
Graph 11: Demand in Denmark from 2022 to 2034
Graph 12: Production in Denmark from 2022 to 2034
Graph 13: Demand in Finland from 2022 to 2034
Graph 14: Production in Finland from 2022 to 2034
Graph 15: Demand in France from 2022 to 2034
Graph 16: Production in France from 2022 to 2034
Graph 17: Demand in Germany from 2022 to 2034
Graph 18: Production in Germany from 2022 to 2034
Graph 19: Demand in Greece from 2022 to 2034
Graph 20: Production in Greece from 2022 to 2034
Graph 21: Demand in Hungary from 2022 to 2034
Graph 22: Production in Hungary from 2022 to 2034
Graph 23: Demand in Italy from 2022 to 2034
Graph 24: Production in Italy from 2022 to 2034
Graph 25: Demand in Norway from 2022 to 2034
Graph 26: Production in Norway from 2022 to 2034
Graph 27: Demand in Poland from 2022 to 2034
Graph 28: Production in Poland from 2022 to 2034
Graph 29: Demand in Portugal from 2022 to 2034
Graph 30: Production in Portugal from 2022 to 2034
Graph 31: Demand in Romania from 2022 to 2034
Graph 32: Production in Romania from 2022 to 2034
Graph 33: Demand in Russia from 2022 to 2034
Graph 34: Production in Russia from 2022 to 2034
Graph 35: Demand in Slovakia from 2022 to 2034
Graph 36: Production in Slovakia from 2022 to 2034
Graph 37: Demand in Slovenia from 2022 to 2034
Graph 38: Production in Slovenia from 2022 to 2034
Graph 39: Demand in Spain from 2022 to 2034
Graph 40: Production in Spain from 2022 to 2034
Graph 41: Demand in Sweden from 2022 to 2034
Graph 42: Production in Sweden from 2022 to 2034
Graph 43: Demand in Switzerland from 2022 to 2034
Graph 44: Production in Switzerland from 2022 to 2034
Graph 45: Demand in the Netherlands from 2022 to 2034
Graph 46: Production in the Netherlands from 2022 to 2034
Graph 47: Demand in Türkiye from 2022 to 2034
Graph 48: Production in Türkiye from 2022 to 2034
Graph 49: Demand in the United Kingdom from 2022 to 2034
Graph 50: Production in the United Kingdom from 2022 to 2034
Graph 51: Demand in the remaining countries of Europe from 2022 to 2034
Graph 52: Production in the remaining countries of Europe from 2022 to 2034
Table 1: Demand in Europe from 2022 to 2034 – split by country
Table 2: Revenues generated in Europe from 2022 to 2034 in million USD and million EUR
Table 3: Production in Europe from 2022 to 2034 – split by country
Table 4: Demand in Europe from 2022 to 2034 – split by application
Table 5: Demand in the “construction” segment in Europe from 2022 to 2034 – split by country
Table 6: Demand in the “industry” segment in Europe from 2022 to 2034 – split by country
Table 7: Demand in the “transportation” segment in Europe from 2022 to 2034 – split by country
Table 8: Demand in the “wood processing” segment in Europe from 2022 to 2034 – split by country
Table 9: Demand in the “other applications” segment in Europe from 2022 to 2034 – split by country
Table 10: Revenues generated in Europe from 2022 to 2034 – split by application
Table 11: Revenues generated in the “construction” segment in Europe from 2022 to 2034 – split by country
Table 12: Revenues generated in the “industry” segment in Europe from 2022 to 2034 – split by country
Table 13: Revenues generated in the “transportation” segment in Europe from 2022 to 2034 – split by country
Table 14: Revenues generated in the “wood processing” segment in Europe from 2022 to 2034 – split by country
Table 15: Revenues generated in the “other applications” segment in Europe from 2022 to 2034 – split by country
Table 16: Demand in the “construction” application area in Europe from 2022 to 2034 – split by construction segment
Table17: Demand in the “new construction” segment in Europe from 2022 to 2034 – split by country
Table 18: Demand in the “renovation” segment in Europe from 2022 to 2034 – split by country
Table 19: Demand in the “residential construction” segment in Europe from 2022 to 2034 – split by country
Table 20: Demand in the “non-residential construction” segment in Europe from 2022 to 2034 – split by country
Table 21: Demand in Europe from 2022 to 2034 – split by product
Table 22: Demand for “vinyl paints” in Europe from 2022 to 2034 – split by country
Table 23: Demand for “acrylic paints” in Europe from 2022 to 2034 – split by country
Table 24: Demand for “alkyd paints” in Europe from 2022 to 2034 – split by country
Table 25: Demand for “epoxy paints” in Europe from 2022 to 2034 – split by country
Table 26: Demand for “polyurethane paints” in Europe from 2022 to 2034 – split by country
Table 27: Demand for “polyester paints” in Europe from 2022 to 2034 – split by country
Table 28: Demand for “paints based on other polymers” in Europe from 2022 to 2034 – split by country
Table 29: Demand for “other products” in Europe from 2022 to 2034 – split by country
Table 30: Demand in Europe from 2022 to 2034 – split by technology
Table 31: Demand for “water-based paints and coatings” in Europe from 2022 to 2034 – split by country
Table 32: Demand for “solvent-based paints and coatings” in Europe from 2022 to 2034 – split by country
Table 33: Demand for “powder coatings” in Europe from 2022 to 2034 – split by country
Table 34: Demand for “other technologies” in Europe from 2022 to 2034 – split by country
Table 35: Revenues generated in Austria from 2022 to 2034, in million USD and million EUR
Table 36: Revenues generated in Austria from 2022 to 2034 – split by application
Table 37: Demand in Austria from 2022 to 2034 – split by application
Table 38: Demand in Austria in the “construction” application area from 2022 to 2034 – split by construction segment
Table 39: Demand in Austria from 2022 to 2034 – split by product
Table 40: Demand in Austria from 2022 to 2034 – split by technology
Table 41: Production, import, export, and demand in Austria from 2022 to 2034
Table 42: Revenues generated in Belgium from 2022 to 2034, in million USD and million EUR
Table 43: Revenues generated in Belgium from 2022 to 2034 – split by application
Table44: Demand in Belgium from 2022 to 2034 – split by application
Table 45: Demand in Belgium in the “construction” application area from 2022 to 2034 – split by construction segment
Table46: Demand in Belgium from 2022 to 2034 – split by product
Table47: Demand in Belgium from 2022 to 2034 – split by technology
Table48: Production, import, export, and demand in Belgium from 2022 to 2034
Table 49: Revenues generated in Czechia from 2022 to 2034, in million USD and million EUR
Table 50: Revenues generated in Czechia from 2022 to 2034 – split by application
Table 51: Demand in Czechia from 2022 to 2034 – split by application
Table 52: Demand in Czechia in the “construction” application area from 2022 to 2034 – split by construction segment
Table 53: Demand in Czechia from 2022 to 2034 – split by product
Table 54: Demand in Czechia from 2022 to 2034 – split by technology
Table 55: Production, import, export, and demand in Czechia from 2022 to 2034
Table 56: Revenues generated in Denmark from 2022 to 2034, in million USD and million EUR
Table 57: Revenues generated in Denmark from 2022 to 2034 – split by application
Table 58: Demand in Denmark from 2022 to 2034 – split by application
Table 59: Demand in Denmark in the “construction” application area from 2022 to 2034 – split by construction segment
Table 60: Demand in Denmark from 2022 to 2034 – split by product
Table 61: Demand in Denmark from 2022 to 2034 – split by technology
Table 62: Production, import, export, and demand in Denmark from 2022 to 2034
Table 63: Revenues generated in Finland from 2022 to 2034, in million USD and million EUR
Table 64: Revenues generated in Finland from 2022 to 2034 – split by application
Table 65: Demand in Finland from 2022 to 2034 – split by application
Table 66: Demand in Finland in the “construction” application area from 2022 to 2034 – split by construction segment
Table 67: Demand in Finland from 2022 to 2034 – split by product
Table 68: Demand in Finland from 2022 to 2034 – split by technology
Table 69: Production, import, export, and demand in Finland from 2022 to 2034
Table 70: Revenues generated in France from 2022 to 2034, in million USD and million EUR
Table 71: Revenues generated in France from 2022 to 2034 – split by application
Table 72: Demand in France from 2022 to 2034 – split by application
Table 73: Demand in France in the “construction” application area from 2022 to 2034 – split by construction segment
Table 74: Demand in France from 2022 to 2034 – split by product
Table 75: Demand in France from 2022 to 2034 – split by technology
Table 76: Production, import, export, and demand in France from 2022 to 2034
Table 77: Revenues generated in Germany from 2022 to 2034, in million USD and million EUR
Table 78: Revenues generated in Germany from 2022 to 2034 – split by application
Table 79: Demand in Germany from 2022 to 2034 – split by application
Table 80: Demand in Germany in the “construction” application area from 2022 to 2034 – split by construction segment
Table 81: Demand in Germany from 2022 to 2034 – split by product
Table 82: Demand in Germany from 2022 to 2034 – split by technology
Table 83: Production, import, export, and demand in Germany from 2022 to 2034
Table 84: Revenues generated in Greece from 2022 to 2034, in million USD and million EUR
Table 85: Revenues generated in Greece from 2022 to 2034 – split by application
Table 86: Demand in Greece from 2022 to 2034 – split by application
Table 87: Demand in Greece in the “construction” application area from 2022 to 2034 – split by construction segment
Table 88: Demand in Greece from 2022 to 2034 – split by product
Table 89: Demand in Greece from 2022 to 2034 – split by technology
Table 90: Production, import, export, and demand in Greece from 2022 to 2034
Table 91: Revenues generated in Hungary from 2022 to 2034, in million USD and million EUR
Table 92: Revenues generated in Hungary from 2022 to 2034 – split by application
Table 93: Demand in Hungary from 2022 to 2034 – split by application
Table 94: Demand in Hungary in the “construction” application area from 2022 to 2034 – split by construction segment
Table 95: Demand in Hungary from 2022 to 2034 – split by product
Table 96: Demand in Hungary from 2022 to 2034 – split by technology
Table 97: Production, import, export, and demand in Hungary from 2022 to 2034
Table 98: Revenues generated in Italy from 2022 to 2034, in million USD and million EUR
Table 99: Revenues generated in Italy from 2022 to 2034 – split by application
Table 100: Demand in Italy from 2022 to 2034 – split by application
Table 101: Demand in Italy in the “construction” application area from 2022 to 2034 – split by construction segment
Table 102: Demand in Italy from 2022 to 2034 – split by product
Table 103: Demand in Italy from 2022 to 2034 – split by technology
Table 104: Production, import, export, and demand in Italy from 2022 to 2034
Table 105: Revenues generated in Norway from 2022 to 2034, in million USD and million EUR
Table 106: Revenues generated in Norway from 2022 to 2034 – split by application
Table 107: Demand in Norway from 2022 to 2034 – split by application
Table 108: Demand in Norway in the “construction” application area from 2022 to 2034 – split by construction segment
Table 109: Demand in Norway from 2022 to 2034 – split by product
Table 110: Demand in Norway from 2022 to 2034 – split by technology
Table 111: Production, import, export, and demand in Norway from 2022 to 2034
Table 112: Revenues generated in Poland from 2022 to 2034, in million USD and million EUR
Table 113: Revenues generated in Poland from 2022 to 2034 – split by application
Table 114: Demand in Poland from 2022 to 2034 – split by application
Table 115: Demand in Poland in the “construction” application area from 2022 to 2034 – split by construction segment
Table 116: Demand in Poland from 2022 to 2034 – split by product
Table 117: Demand in Poland from 2022 to 2034 – split by technology
Table 118: Production, import, export, and demand in Poland from 2022 to 2034
Table 119: Revenues generated in Portugal from 2022 to 2034, in million USD and million EUR
Table 120: Revenues generated in Portugal from 2022 to 2034 – split by application
Table 121: Demand in Portugal from 2022 to 2034 – split by application
Table 122: Demand in Portugal in the “construction” application area from 2022 to 2034 – split by construction segment
Table 123: Demand in Portugal from 2022 to 2034 – split by product
Table 124: Demand in Portugal from 2022 to 2034 – split by technology
Table 125: Production, import, export, and demand in Portugal from 2022 to 2034
Table 126: Revenues generated in Romania from 2022 to 2034, in million USD and million EUR
Table 127: Revenues generated in Romania from 2022 to 2034 – split by application
Table 128: Demand in Romania from 2022 to 2034 – split by application
Table 129: Demand in Romania in the “construction” application area from 2022 to 2034 – split by construction segment
Table 130: Demand in Romania from 2022 to 2034 – split by product
Table 131: Demand in Romania from 2022 to 2034 – split by technology
Table 132: Production, import, export, and demand in Romania from 2022 to 2034
Table 133: Revenues generated in Russia from 2022 to 2034, in million USD and million EUR
Table 134: Revenues generated in Russia from 2022 to 2034 – split by application
Table 135: Demand in Russia from 2022 to 2034 – split by application
Table 136: Demand in Russia in the “construction” application area from 2022 to 2034 – split by construction segment
Table 137: Demand in Russia from 2022 to 2034 – split by product
Table 138: Demand in Russia from 2022 to 2034 – split by technology
Table 139: Production, import, export, and demand in Russia from 2022 to 2034
Table 140: Revenues generated in Slovakia from 2022 to 2034, in million USD and million EUR
Table 141: Revenues generated in Slovakia from 2022 to 2034 – split by application
Table 142: Demand in Slovakia from 2022 to 2034 – split by application
Table 143: Demand in Slovakia in the “construction” application area from 2022 to 2034 – split by construction segment
Table 144: Demand in Slovakia from 2022 to 2034 – split by product
Table 145: Demand in Slovakia from 2022 to 2034 – split by technology
Table 146: Production, import, export, and demand in Slovakia from 2022 to 2034
Table 147: Revenues generated in Slovenia from 2022 to 2034, in million USD and million EUR
Table 148: Revenues generated in Slovenia from 2022 to 2034 – split by application
Table 149: Demand in Slovenia from 2022 to 2034 – split by application
Table 150: Demand in Slovenia in the “construction” application area from 2022 to 2034 – split by construction segment
Table 151: Demand in Slovenia from 2022 to 2034 – split by product
Table 152: Demand in Slovenia from 2022 to 2034 – split by technology
Table 153: Production, import, export, and demand in Slovenia from 2022 to 2034
Table 154: Revenues generated in Spain from 2022 to 2034, in million USD and million EUR
Table 155: Revenues generated in Spain from 2022 to 2034 – split by application
Table 156: Demand in Spain from 2022 to 2034 – split by application
Table 157: Demand in Spain in the “construction” application area from 2022 to 2034 – split by construction segment
Table 158: Demand in Spain from 2022 to 2034 – split by product
Table 159: Demand in Spain from 2022 to 2034 – split by technology
Table 160: Production, import, export, and demand in Spain from 2022 to 2034
Table 161: Revenues generated in Sweden from 2022 to 2034, in million USD and million EUR
Table 162: Revenues generated in Sweden from 2022 to 2034 – split by application
Table 163: Demand in Sweden from 2022 to 2034 – split by application
Table 164: Demand in Sweden in the “construction” application area from 2022 to 2034 – split by construction segment
Table 165: Demand in Sweden from 2022 to 2034 – split by product
Table 166: Demand in Sweden from 2022 to 2034 – split by technology
Table 167: Production, import, export, and demand in Sweden from 2022 to 2034
Table 168: Revenues generated in Switzerland from 2022 to 2034, in million USD and million EUR
Table 169: Revenues generated in Switzerland from 2022 to 2034 – split by application
Table170: Demand in Switzerland from 2022 to 2034 – split by application
Table 171: Demand in Switzerland in the “construction” application area from 2022 to 2034 – split by construction segment
Table172: Demand in Switzerland from 2022 to 2034 – split by product
Table173: Demand in Switzerland from 2022 to 2034 – split by technology
Table174: Production, import, export, and demand in Switzerland from 2022 to 2034
Table 175: Revenues generated in the Netherlands from 2022 to 2034, in million USD and million EUR
Table 176: Revenues generated in the Netherlands from 2022 to 2034 – split by application
Table 177: Demand in the Netherlands from 2022 to 2034 – split by application
Table 178: Demand in the Netherlands in the “construction” application area from 2022 to 2034 – split by construction segment
Table 179: Demand in the Netherlands from 2022 to 2034 – split by product
Table 180: Demand in the Netherlands from 2022 to 2034 – split by technology
Table 181: Production, import, export, and demand in the Netherlands from 2022 to 2034
Table 182: Revenues generated in Türkiye from 2022 to 2034, in million USD and million EUR
Table 183: Revenues generated in Türkiye from 2022 to 2034 – split by application
Table 184: Demand in Türkiye from 2022 to 2034 – split by application
Table 185: Demand in Türkiye in the “construction” application area from 2022 to 2034 – split by construction segment
Table 186: Demand in Türkiye from 2022 to 2034 – split by product
Table 187: Demand in Türkiye from 2022 to 2034 – split by technology
Table 188: Production, import, export, and demand in Türkiye from 2022 to 2034
Table 189: Revenues generated in the United Kingdom from 2022 to 2034, in million USD and million EUR
Table 190: Revenues generated in the United Kingdom from 2022 to 2034 – split by application
Table 191: Demand in the United Kingdom from 2022 to 2034 – split by application
Table 192: Demand in the United Kingdom in the “construction” application area from 2022 to 2034 – split by construction segment
Table 193: Demand in the United Kingdom from 2022 to 2034 – split by product
Table 194: Demand in the United Kingdom from 2022 to 2034 – split by technology
Table 195: Production, import, export, and demand in the United Kingdom from 2022 to 2034
Table 196: Revenues generated in the remaining countries of Europe from 2022 to 2034, in million USD and million EUR
Table 197: Revenues generated in the remaining countries of Europe from 2022 to 2034 – split by application
Table 198: Demand in the remaining countries of Europe from 2022 to 2034 – split by application
Table 199: Demand in the remaining countries of Europe in the “construction” application area from 2022 to 2034 – split by construction segment
Table 200: Demand in the remaining countries of Europe from 2022 to 2034 – split by product
Table 201: Demand in the remaining countries of Europe from 2022 to 2034 – split by technology
Table 202: Production, import, export, and demand in the remaining countries of Europe from 2022 to 2034


