

Description
The Insulation Material Market Report – Europe is now also available in parts (e.g. individual country profiles or all manufacturer profiles). Please feel free to contact us and we will immediately send you an offer for your specific selection.
How many billions of euros can the construction industry expect? Europe’s construction industry is eagerly awaiting the details of the German “Special Fund for Infrastructure and Climate Neutrality” and the “Made for Germany” initiative. Some of the gigantic investments will in any case be spent on buildings – and therefore also on thermal insulation and energy-efficient refurbishment. Ceresana is now publishing insulation material market data and forecasts for the entire European insulation market for the seventh time. Around 210 million cubic meters of insulating materials are currently used in the construction industry in Europe every year. (Insulation materials for other sectors, such as the automotive industry, household and commercial appliances, or industrial process plants, are not covered in this study).
Insulation Industry Hopes for an Upturn
Over the past two years, Ceresana’s market researchers have recorded an overall decline in demand for insulation materials in Europe (including Russia and Türkiye). Although the renovation construction sector is developing dynamically in various regions, it can only partially compensate for the tense situation in new construction, where new projects are being abandoned, downsized, or postponed. The completion of new apartments could now bottom out in the current year: The construction industry in Europe is expected to stabilize slightly from 2026. In some countries, however, the turnaround in the insulation market is likely to take a little longer. In Italy and France, major support programs for the construction industry have just ended. The manufacturers and processors of insulation materials are now expecting a lot from the billions in government spending in Germany, but also from the EU Commission’s plans to make the European Union independent of oil and gas from Russia by 2030 and climate-neutral by 2050 by investing in energy efficiency and energy saving. In addition to an analysis of the insulation market development the new market report by Ceresana also provides background information on the regulatory framework in the EU as well as the general economic situation and the situation of the construction industry in the individual countries, including important companies, construction activities, investments, and planned construction projects.
Trend Towards Foam Insulation
According to Ceresana’s market research, the demand for expanded polystyrene (EPS), which is sold under trade names such as Styrofoam or Airpop, is currently growing in Europe. Other foamed plastics are also used for thermal insulation and soundproofing: extruded polystyrene (XPS), polyurethane (PUR), and polyisocyanurate (PIR). On the one hand, synthetic insulating materials made from plastics are produced from crude oil or natural gas and have to be treated with flame retardants. On the other hand, they score points for durability, weather resistance, low weight, and, so far, low costs. The mineral wool market, which includes mineral fiber insulation materials made from rock wool or glass wool, is developing less dynamically. Bio-based insulation materials, which are ideally compatible with bio-based paints and coatings, bio-adhesives, and ecologically beneficial building materials, still only account for a small proportion of the total European insulation market. The types of insulation material used vary greatly from region to region. Ceresana’s new market report therefore deals with the specific circumstances and factors in chapters focused on individual countries.
Current Market Study “Insulation Materials – Europe” (7th Edition):
Chapter 1 provides a well-founded overview of the entire European market for insulation materials in the construction industry with forecasts up to the year 2034. Clear tables and graphs provide up-to-date market data on the demand split by construction segments and on the most important types of insulation material:
Total revenue, production, and demand for:
- EPS
- XPS
- PUR/PIR
- Glass wool
- Stone wool
A separate section provides a brief overview of bio-based insulation materials.
Chapter 2 presents a detailed analysis of the thermal insulation market size and growth in 18 European countries: Demand, revenues, production, and trade of insulation materials are each considered individually. The key figures in millions of cubic meters are shown separately for the various insulation material types.
Demand is also broken down into the construction segments:
- New construction
- Renovation
- Residential construction
- Non-residential construction
Chapter 3 presents company profiles of the most important insulation manufacturers – clearly arranged according to contact details, revenues, net income, product range, production sites, profile summary, as well as product types and insulation application areas. In-depth profiles of the 49 most important manufacturers are provided, including Compagnie de Saint-Gobain S.A., Holcim Ltd., Sika AG, Knauf Insulation GmbH, Kingspan Group plc, SOPREMA Group SAS, Etex Group, and ROCKWOOL International A/S.
=> The market study “Biobased Insulation Materials – Europe (2nd Edition)” is available from Ceresana specifically on thermal insulation products made from wood, cellulose, and other renewable raw materials. Ceresana also regularly analyzes the entire global market for insulation materials. Also interesting in this context are current Ceresana market studies on flame retardants, paints and coatings, adhesives and various construction products, for example windows, doors and plastic pipes.
Scope of the Report:
Attributes | Details |
| Base Year | 2024 |
| Trend Period | 2022 – 2034 |
| Forecast Period | 2025 – 2034 |
| Pages | 280 |
| Product Types | EPS, XPS, PUR/PIR, glass wool, and stone wool |
| Segments | New construction, renovation, residential construction, and non-residential construction |
| Company Profiles | Saint-Gobain, Holcim, Sika, Knauf Insulation, Kingspan, SOPREMA, Etex, and ROCKWOOL (Selection) |
| Edition | 7th edition |
| Publication | July 2025 |
FAQs
How big is the market for insulation materials in Europe?
The construction industry in Europe currently consumes around 210 million cubic metres of insulation materials per year.
Which insulation material is showing the biggest growth?
In Europe, consumption of expandable polystyrene (EPS), which is sold under trade names such as Airpop, Styropor or Styrofoam, is growing in particular. The market share of bio-based insulation materials is still relatively small.
Are natural insulation materials fireproof?
The fire behaviour of bio-based insulation materials is often better and more predictable than that of foamed plastics, which can burn extremely quickly, dripping and producing a lot of toxic smoke.
1 Market Data
1.1 Demand
1.2 Revenues
1.3 Production
1.4 Demand by construction segment
1.4.1 New construction
1.4.2 Renovation
1.4.3 Residential construction
1.4.4 Non-residential construction
1.5 Demand by insulation material
1.5.1 Expanded polystyrene (EPS) & extruded polystyrene (XPS)
1.5.2 Polyurethane (PUR) & Polyisocyanurate (PIR)
1.5.3 Glass wool
1.5.4 Stone wool
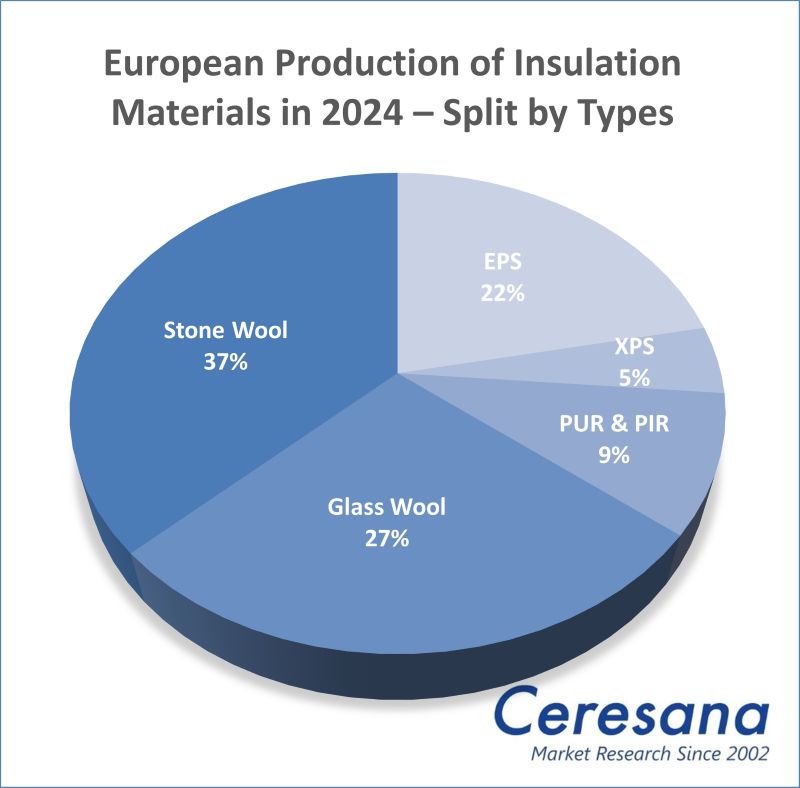
1.6 Production by insulation material
1.6.1 EPS
1.6.2 XPS
1.6.3 PUR & PIR
1.6.4 Glass wool
1.6.5 Stone wool
1.7 Excursus: Biobased Insulation
1.7.1 Wood
1.7.2 Cellulose
1.7.3 Straw
1.7.4 Hemp
1.7.5 Flax
1.7.6 Reed
1.7.7 Grass
1.7.8 Cork
1.7.9 Coconut (Coir)
1.7.10 Others
1.8 Excursus: Regulations and Directives in the European Union (EU)
1.8.1 General Information
1.8.2 Construction Industry
2 Market Data: Country Profiles
2.1 Austria
2.1.1 Demand & Revenues
2.1.2 Production & Trade
2.2 Belgium
2.2.1 Demand & Revenues
2.2.2 Production & Trade
2.3 Czechia
2.3.1 Demand & Revenues
2.3.2 Production & Trade
2.4 Finland
2.4.1 Demand & Revenues
2.4.2 Production & Trade
2.5 France
2.5.1 Demand & Revenues
2.5.2 Production & Trade
2.6 Germany
2.6.1 Demand & Revenues
2.6.2 Production & Trade
2.7 Italy
2.7.1 Demand & Revenues
2.7.2 Production & Trade
2.8 Norway
2.8.1 Demand & Revenues
2.8.2 Production & Trade
2.9 Poland
2.9.1 Demand & Revenues
2.9.2 Production & Trade
2.10 Romania
2.10.1 Demand & Revenues
2.10.2 Production & Trade
2.11 Russia
2.11.1 Demand & Revenues
2.11.2 Production & Trade
2.12 Spain
2.12.1 Demand & Revenues
2.12.2 Production & Trade
2.13 Sweden
2.13.1 Demand & Revenues
2.13.2 Production & Trade
2.14 Switzerland
2.14.1 Demand & Revenues
2.14.2 Production & Trade
2.15 The Netherlands
2.15.1 Demand & Revenues
2.15.2 Production & Trade
2.16 Türkiye
2.16.1 Demand & Revenues
2.16.2 Production & Trade
2.17 Ukraine
2.17.1 Demand & Revenues
2.17.2 Production & Trade
2.18 United Kingdom
2.18.1 Demand & Revenues
2.18.2 Production & Trade
2.19 Other Europe
2.19.1 Demand & Revenues
2.19.2 Production & Trade
3 Company Profiles*
Austria (4 Producers)
Belgium (5)
Denmark (1)
Finland (2)
France (2)
Germany (9)
Greece (2)
Hungary (1)
Ireland (1)
Italy (3)
Luxembourg (1)
Norway (2)
Poland (2)
Russia (3)
Slovenia (1)
Spain (1)
Switzerland (5)
Türkiye (2)
United Kingdom (3)
*Note: The profiles are assigned to the country in which the company or holding is headquartered. Profiles also include JVs and subsidiaries.
Graph 1: European demand from 2022 to 2034
Graph 2: Revenues generated in Europe from 2022 to 2034, in billion USD and billion EUR
Graph 3: European production from 2022 to 2034
Graph 4: European demand for biobased insulation materials in 2024 – split by material
Graph 5: Demand in Austria from 2022 to 2034
Graph 6: Production in Austria from 2022 to 2034
Graph 7: Demand in Belgium from 2022 to 2034
Graph 8: Production in Belgium from 2022 to 2034
Graph 9: Demand in Czechia from 2022 to 2034
Graph 10: Production in Czechia from 2022 to 2034
Graph 11: Demand in Finland from 2022 to 2034
Graph 12: Production in Finland from 2022 to 2034
Graph 13: Demand in France from 2022 to 2034
Graph 14: Production in France from 2022 to 2034
Graph 15: Demand in Germany from 2022 to 2034
Graph 16: Production in Germany from 2022 to 2034
Graph 17: Demand in Italy from 2022 to 2034
Graph 18: Production in Italy from 2022 to 2034
Graph 19: Demand in Norway from 2022 to 2034
Graph 20: Production in Norway from 2022 to 2034
Graph 21: Demand in Poland from 2022 to 2034
Graph 22: Production in Poland from 2022 to 2034
Graph 23: Demand in Romania from 2022 to 2034
Graph 24: Production in Romania from 2022 to 2034
Graph 25: Demand in Russia from 2022 to 2034
Graph 26: Production in Russia from 2022 to 2034
Graph 27: Demand in Spain from 2022 to 2034
Graph 28: Production in Spain from 2022 to 2034
Graph 29: Demand in Sweden from 2022 to 2034
Graph 30: Production in Sweden from 2022 to 2034
Graph 31: Demand in Switzerland from 2022 to 2034
Graph 32: Production in Switzerland from 2022 to 2034
Graph 33: Demand in the Netherlands from 2022 to 2034
Graph 34: Production in the Netherlands from 2022 to 2034
Graph 35: Demand in Türkiye from 2022 to 2034
Graph 36: Production in Türkiye from 2022 to 2034
Graph 37: Demand in Ukraine from 2022 to 2034
Graph 38: Production in Ukraine from 2022 to 2034
Graph 39: Demand in the United Kingdom from 2022 to 2034
Graph 40: Production in the United Kingdom from 2022 to 2034
Graph 41: Demand in the remaining countries of Europe from 2022 to 2034
Graph 42: Production in the remaining countries of Europe from 2022 to 2034
Table 1: European demand from 2022 to 2034 – split by country
Table 2: Revenues generated in Europe from 2022 to 2034, in million USD and million EUR
Table 3: European production from 2022 to 2034 – split by country
Table 4: European demand from 2022 to 2034 – split by construction segment
Table 5: European demand in the “new construction” segment from 2022 to 2034 – split by country
Table 6: European demand in the “renovation” segment from 2022 to 2034 – split by country
Table 7: European demand in the “residential construction” segment from 2022 to 2034 – split by country
Table 8: European demand in the “non-residential construction” segment from 2022 to 2034 – split by country
Table 9: European demand from 2022 to 2034 – split by type of insulation material
Table 10: European demand for insulation materials made of “EPS and XPS” from 2022 to 2034 – split by country
Table11: European demand for insulation materials made of “PUR and PIR” from 2022 to 2034 – split by country
Table 12: European demand for insulation materials made of “glass wool” from 2022 to 2034 – split by country
Table 13: European demand for insulation materials made of “stone wool” from 2022 to 2034 – split by country
Table 14: European production from 2022 to 2034 – split by type of insulation material
Table 15: European production of insulation materials made of “EPS” from 2022 to 2034 – split by country
Table 16: European production of insulation materials made of “XPS” from 2022 to 2034 – split by country
Table 17: European production of insulation materials made of “PUR and PIR” from 2022 to 2034 – split by country
Table 18: European production of insulation materials made of “glass wool” from 2022 to 2034 – split by country
Table 19: European production of insulation materials made of “stone wool” from 2022 to 2034 – split by country
Table 20: Revenues generated in Austria from 2022 to 2034, in million USD and million EUR
Table 21: Demand in Austria from 2022 to 2034 – split by construction segment
Table 22: Demand in Austria from 2022 to 2034 – split by type of insulation material
Table 23: Production, import, export, and demand in Austria from 2022 to 2034
Table 24: Production in Austria from 2022 to 2034 – split by type of insulation material
Table 25: Import and export in Austria from 2022 to 2034 – split by type of insulation material
Table 26: Revenues generated in Belgium from 2022 to 2034, in million USD and million EUR
Table 27: Demand in Belgium from 2022 to 2034 – split by construction segment
Table 28: Demand in Belgium from 2022 to 2034 – split by type of insulation material
Table 29: Production, import, export, and demand in Belgium from 2022 to 2034
Table 30: Production in Belgium from 2022 to 2034 – split by type of insulation material
Table 31: Import and export in Belgium from 2022 to 2034 – split by type of insulation material
Table 32: Revenues generated in Czechia from 2022 to 2034, in million USD and million EUR
Table 33: Demand in Czechia from 2022 to 2034 – split by construction segment
Table 34: Demand in Czechia from 2022 to 2034 – split by type of insulation material
Table 35: Production, import, export, and demand in Czechia from 2022 to 2034
Table 36: Production in Czechia from 2022 to 2034 – split by type of insulation material
Table 37: Import and export in Czechia from 2022 to 2034 – split by type of insulation material
Table 38: Revenues generated in Finland from 2022 to 2034, in million USD and million EUR
Table 39: Demand in Finland from 2022 to 2034 – split by construction segment
Table 40: Demand in Finland from 2022 to 2034 – split by type of insulation material
Table 41: Production, import, export, and demand in Finland from 2022 to 2034
Table 42: Production in Finland from 2022 to 2034 – split by type of insulation material
Table 43: Import and export in Finland from 2022 to 2034 – split by type of insulation material
Table 44: Revenues generated in France from 2022 to 2034, in million USD and million EUR
Table 45: Demand in France from 2022 to 2034 – split by construction segment
Table 46: Demand in France from 2022 to 2034 – split by type of insulation material
Table 47: Production, import, export, and demand in France from 2022 to 2034
Table 48: Production in France from 2022 to 2034 – split by type of insulation material
Table 49: Import and export in France from 2022 to 2034 – split by type of insulation material
Table 50: Revenues generated in Germany from 2022 to 2034, in million USD and million EUR
Table 51: Demand in Germany from 2022 to 2034 – split by construction segment
Table 52: Demand in Germany from 2022 to 2034 – split by type of insulation material
Table 53: Production, import, export, and demand in Germany from 2022 to 2034
Table 54: Production in Germany from 2022 to 2034 – split by type of insulation material
Table 55: Import and export in Germany from 2022 to 2034 – split by type of insulation material
Table 56: Revenues generated in Italy from 2022 to 2034, in million USD and million EUR
Table 57: Demand in Italy from 2022 to 2034 – split by construction segment
Table 58: Demand in Italy from 2022 to 2034 – split by type of insulation material
Table 59: Production, import, export, and demand in Italy from 2022 to 2034
Table 60: Production in Italy from 2022 to 2034 – split by type of insulation material
Table 61: Import and export in Italy from 2022 to 2034 – split by type of insulation material
Table 62: Revenues generated in Norway from 2022 to 2034, in million USD and million EUR
Table 63: Demand in Norway from 2022 to 2034 – split by construction segment
Table 64: Demand in Norway from 2022 to 2034 – split by type of insulation material
Table 65: Production, import, export, and demand in Norway from 2022 to 2034
Table 66: Production in Norway from 2022 to 2034 – split by type of insulation material
Table 67: Import and export in Norway from 2022 to 2034 – split by type of insulation material
Table 68: Revenues generated in Poland from 2022 to 2034, in million USD and million EUR
Table 69: Demand in Poland from 2022 to 2034 – split by construction segment
Table 70: Demand in Poland from 2022 to 2034 – split by type of insulation material
Table 71: Production, import, export, and demand in Poland from 2022 to 2034
Table 72: Production in Poland from 2022 to 2034 – split by type of insulation material
Table 73: Import and export in Poland from 2022 to 2034 – split by type of insulation material
Table 74: Revenues generated in Romania from 2022 to 2034, in million USD and million EUR
Table 75: Demand in Romania from 2022 to 2034 – split by construction segment
Table 76: Demand in Romania from 2022 to 2034 – split by type of insulation material
Table 77: Production, import, export, and demand in Romania from 2022 to 2034
Table 78: Production in Romania from 2022 to 2034 – split by type of insulation material
Table 79: Import and export in Romania from 2022 to 2034 – split by type of insulation material
Table 80: Revenues generated in Russia from 2022 to 2034, in million USD and million EUR
Table 81: Demand in Russia from 2022 to 2034 – split by construction segment
Table 82: Demand in Russia from 2022 to 2034 – split by type of insulation material
Table 83: Production, import, export, and demand in Russia from 2022 to 2034
Table 84: Production in Russia from 2022 to 2034 – split by type of insulation material
Table 85: Import and export in Russia from 2022 to 2034 – split by type of insulation material
Table 86: Revenues generated in Spain from 2022 to 2034, in million USD and million EUR
Table 87: Demand in Spain from 2022 to 2034 – split by construction segment
Table 88: Demand in Spain from 2022 to 2034 – split by type of insulation material
Table 89: Production, import, export, and demand in Spain from 2022 to 2034
Table 90: Production in Spain from 2022 to 2034 – split by type of insulation material
Table 91: Import and export in Spain from 2022 to 2034 – split by type of insulation material
Table 92: Revenues generated in Sweden from 2022 to 2034, in million USD and million EUR
Table 93: Demand in Sweden from 2022 to 2034 – split by construction segment
Table 94: Demand in Sweden from 2022 to 2034 – split by type of insulation material
Table 95: Production, import, export, and demand in Sweden from 2022 to 2034
Table 96: Production in Sweden from 2022 to 2034 – split by type of insulation material
Table 97: Import and export in Sweden from 2022 to 2034 – split by type of insulation material
Table 98: Revenues generated in Switzerland from 2022 to 2034, in million USD and million EUR
Table 99: Demand in Switzerland from 2022 to 2034 – split by construction segment
Table 100: Demand in Switzerland from 2022 to 2034 – split by type of insulation material
Table 101: Production, import, export, and demand in Switzerland from 2022 to 2034
Table 102: Production in Switzerland from 2022 to 2034 – split by type of insulation material
Table 103: Import and export in Switzerland from 2022 to 2034 – split by type of insulation material
Table 104: Revenues generated in the Netherlands from 2022 to 2034, in million USD and million EUR
Table 105: Demand in the Netherlands from 2022 to 2034 – split by construction segment
Table 106: Demand in the Netherlands from 2022 to 2034 – split by type of insulation material
Table 107: Production, import, export, and demand in the Netherlands from 2022 to 2034
Table 108: Production in the Netherlands from 2022 to 2034 – split by type of insulation material
Table 109: Import and export in the Netherlands from 2022 to 2034 – split by type of insulation material
Table 110: Revenues generated in Türkiye from 2022 to 2034, in million USD and million EUR
Table 111: Demand in Türkiye from 2022 to 2034 – split by construction segment
Table 112: Demand in Türkiye from 2022 to 2034 – split by type of insulation material
Table 113: Production, import, export, and demand in Türkiye from 2022 to 2034
Table 114: Production in Türkiye from 2022 to 2034 – split by type of insulation material
Table 115: Import and export in Türkiye from 2022 to 2034 – split by type of insulation material
Table 116: Revenues generated in Ukraine from 2022 to 2034, in million USD and million EUR
Table 117: Demand in Ukraine from 2022 to 2034 – split by construction segment
Table 118: Demand in Ukraine from 2022 to 2034 – split by type of insulation material
Table 119: Production, import, export, and demand in Ukraine from 2022 to 2034
Table 120: Production in Ukraine from 2022 to 2034 – split by type of insulation material
Table 121: Import and export in Ukraine from 2022 to 2034 – split by type of insulation material
Table 122: Revenues generated in the United Kingdom from 2022 to 2034, in million USD and million EUR
Table 123: Demand in the United Kingdom from 2022 to 2034 – split by construction segment
Table 124: Demand in the United Kingdom from 2022 to 2034 – split by type of insulation material
Table 125: Production, import, export, and demand in the United Kingdom from 2022 to 2034
Table 126: Production in the United Kingdom from 2022 to 2034 – split by type of insulation material
Table 127: Import and export in the United Kingdom from 2022 to 2034 – split by type of insulation material
Table 128: Revenues generated in the remaining countries of Europe from 2022 to 2034, in million USD and million EUR
Table 129: Demand in the remaining countries of Europe from 2022 to 2034 – split by construction segment
Table 130: Demand in the remaining countries of Europe from 2022 to 2034 – split by type of insulation material
Table 131: Production, import, export, and demand in the remaining countries of Europe from 2022 to 2034
Table 132: Production in the remaining countries of Europe from 2022 to 2034 – split by type of insulation material
Table 133: Demand in the remaining countries of Europe from 2022 to 2034 – split by type of insulation material


