

Description
The Solvents Market Report – World is now also available in parts (e.g. individual country profiles or all manufacturer profiles). Please feel free to contact us and we will immediately send you an offer for your specific selection.
Are solvents a solution to our waste problem? In any case, they can be used to recover raw materials that are as good as new, even from mixed or contaminated waste: Solvents allow targeted and clean removal of unwanted plastic types, labeling, and impurities. Chemical plastic recycling is an innovative application example for solvents. The potent chemicals can dissolve or dilute other substances without chemically altering them. Not only precision cleaning agents for printed circuit boards and microchips, but also nail polish remover and numerous other everyday products would hardly be possible without isopropyl alcohol, acetone, and more. Ceresana has now analyzed the global market for solvents for the fifth time.
Chemicals for a Colorful World
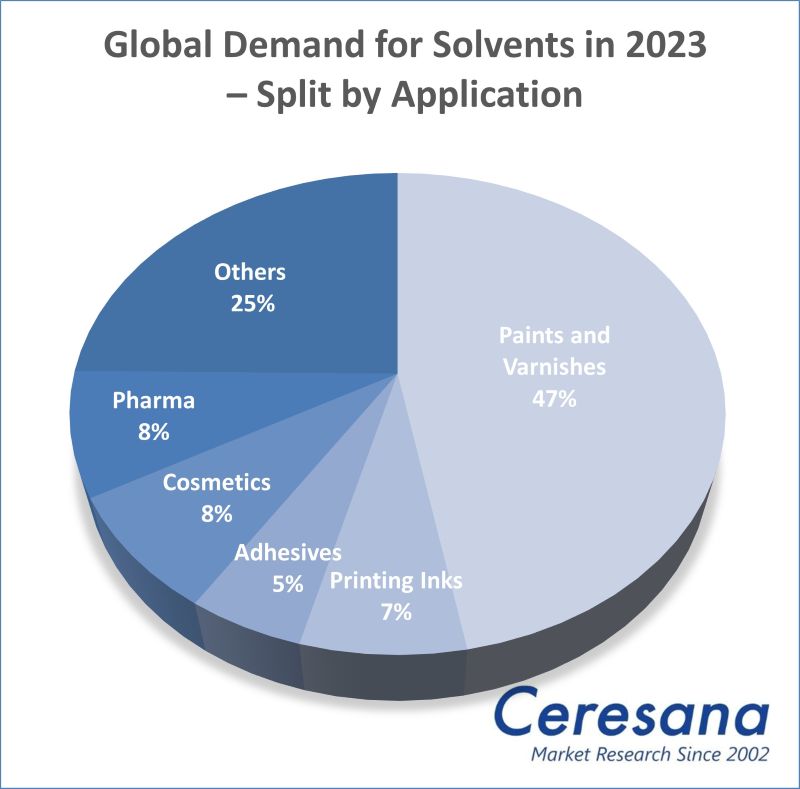
Solvents make paints and coatings processable and make it possible to control their properties in a targeted manner. With around 47% of total demand, companies in the paint industry are the largest consumers of solvents. According to Ceresana’s solvent industry analysis, the pharmaceutical industry is the second-largest application area, followed by the cosmetics, printing inks, and adhesives sectors. Large quantities of solvents are used, for example, for chemical manufacturing processes, degreasing, cleaning, cooling circuits, and de-icing. However, chemicals that can cause unpleasant odors, explosive vapors, health and environmental damage are increasingly controversial and subject to restrictions. The trend is therefore towards more environmentally friendly alternatives, such as bio-based solvents, particularly for products for end consumers and in the food industry. However, water-based paints cannot always replace solvent-based coatings in demanding applications. Even conventional petrochemical solvents are increasingly being mixed with biogenic components from renewable raw materials.
Alcohol as a Cleaning Agent
Alcohols are by far the most popular types of solvent: especially ethanol, n-butanol, isopropanol, and methanol. Ketones (primarily acetone), aromatics (such as toluene and xylene), esters (such as ethyl acetate and butyl acetate), and ethers (such as diethyl ether, THF, or glycol ether) also have significant market shares. Ethanol will record the strongest growth: Ceresana’s solvent market report forecasts an increase in consumption of 3.7% per year for this product. The solvent market is growing particularly in the Africa and Asia-Pacific regions. This is followed by the regions Middle East and South America. The industry in Asia-Pacific currently consumes around 47% of all solvents worldwide – and around 3.5 million tonnes of alcohols alone per year.
Current Solvent Industry Analysis “Solvents – World Report”:
Chapter 1 of the new study by Ceresana provides a comprehensive analysis of the global market for solvents – including forecasts up to 2033: The development of demand (in tonnes) and revenues (in USD and EUR) is explained for each of the following regions: Western and Eastern Europe, North and South America, Asia-Pacific, the Middle East, and Africa. Furthermore, demand and revenues are broken down for six application areas.
The various product types are also analyzed individually:
- Ethanol solvents
- N-butanol
- Isopropanol
- Methanol
- Other alcohols
- Acetone
- Methyl ethyl ketone (MEK, also known as butanone)
- Other ketones
- Esters
- Ethers
- Toluene
- Other aromatics
- Non-aromatics
- Other solvents
In Chapter 2, the market data for 16 countries are analyzed in detail: Demand for and revenues generated with solvents are examined for the most important national solvent markets worldwide. In addition, demand for solvents is split by the various application areas (in tonnes and US dollars) and product types (in tonnes):
Application areas:
- Paints and coatings
- Printing inks
- Adhesives
- Cosmetics & personal care
- Pharmaceuticals
- Other applications
Product types:
- Alcohols
- Ketones
- Esters
- Ethers
- Aromatics
- Non-Aromatics
- Other Solvents
In addition to market data and forecasts, the solvent market report also contains background information on the general economic situation and the situation in the construction industry (as a downstream sector of the paints & coatings and adhesives application areas) in the individual countries.
Chapter 3 provides useful company profiles of the largest solvent manufacturers, clearly arranged according to contact details, revenues, net income, product range, production sites, and profile summary. In-depth profiles of the top 80 producers are given, for example of ExxonMobil Chemical Company, Shell plc, TotalEnergies SE, Orlen S.A., Equinor ASA, Marathon Petroleum Corporation, Valero Energy Corporate, Idemitsu Kosan Co., Ltd., and Sasol Limited.
=> A current market study specifically on bio-based solvents is also available from Ceresana. For the detergents, personal care, and cosmetics sectors in particular, a new Ceresana report on surfactants is also relevant. Furthermore, Ceresana regularly analyzes the global and European markets for the most important application areas of solvents: paints & coatings, printing inks, and adhesives. Bio-based materials are a focus of Ceresana’s market research.
Scope of the Report:
Attributes | Details |
| Base Year | 2023 |
| Trend Period | 2021 – 2033 |
| Forecast Period | 2024 – 2033 |
| Pages | 380 |
| Application Areas | Paints and coatings, printing inks, adhesives, cosmetics & personal care, pharmaceuticals, others |
| Solvent Types | Ethanol solvents, n-butanol, isopropanol, methanol, other alcohols, acetone, methyl ethyl ketone (MEK, also known as butanone), other ketones, esters, ethers, toluene, other aromatics, non-aromatics, other solvents |
| Company Profiles | ExxonMobil, Shell, TotalEnergies, Orlen, Equinor, Marathon Petroleum, Valero Energy, Idemitsu, and Sasol (Selection) |
| Edition | 5th edition |
| Publication | May 2025 |
FAQs
Which region is the largest solvent consumer?
Asia-Pacific accounted for about 47% of global demand in 2023.
Which solvent type dominates the market?
Alcohols are by far the most utilized solvent type.
Which solvent type submarket is forecast to develop most dynamically?
With an expected increase of 3.7% per year, the ethanol segment will be the fastest growing submarket.
1 Market Data: World and Regions
1.1 World
1.1.1 Demand
1.1.2 Revenues
1.1.3 Demand Split by Application Area
1.1.3.1 Paints & Coatings
1.1.3.2 Printing Inks
1.1.3.3 Adhesives
1.1.3.4 Cosmetics & Personal Care
1.1.3.5 Pharmaceuticals
1.1.3.6 Other Applications
1.1.4 Revenues Split by Application Area
1.1.4.1 Paints & Coatings
1.1.4.2 Printing Inks
1.1.4.3 Adhesives
1.1.4.4 Cosmetics & Personal Care
1.1.4.5 Pharmaceuticals
1.1.4.6 Other Applications
1.1.5 Demand Split by Product
1.1.5.1 Alcohols: Ethanol
1.1.5.2 Alcohols: n-Butanol
1.1.5.3 Alcohols: Isopropanol
1.1.5.4 Alcohols: Methanol
1.1.5.5 Alcohols: Others
1.1.5.6 Ketones: Acetone
1.1.5.7 Ketones: MEK
1.1.5.8 Ketones: Others
1.1.5.9 Esters
1.1.5.10 Ethers
1.1.5.11 Aromatics: Toluene
1.1.5.12 Aromatics: Others
1.1.5.13 Non-Aromatics
1.1.5.14 Other Solvents
1.2 Western Europe
1.2.1 Demand
1.2.2 Revenues
1.2.3 Applications and Products
1.3 Eastern Europe
1.3.1 Demand
1.3.2 Revenues
1.3.3 Applications and Products
1.4 North America
1.4.1 Demand
1.4.2 Revenues
1.4.3 Applications and Products
1.5 South America
1.5.1 Demand
1.5.2 Revenues
1.5.3 Applications and Products
1.6 Asia-Pacific
1.6.1 Demand
1.6.2 Revenues
1.6.3 Applications and Products
1.7 Middle East
1.7.1 Demand
1.7.2 Revenues
1.7.3 Applications and Products
1.8 Africa
1.8.1 Demand
1.8.2 Revenues
1.8.3 Applications and Products
2 Market Data: Countries
2.1 Western Europe
2.1.1 France
2.1.2 Germany
2.1.3 Italy
2.1.4 Spain
2.1.5 United Kingdom
2.1.6 Other Western Europe
2.2 Eastern Europe
2.2.1 Poland
2.2.2 Russia
2.2.3 Türkiye
2.2.4 Other Eastern Europe
2.3 North America
2.3.1 Canada
2.3.2 Mexico
2.3.3 USA
2.4 South America
2.4.1 Brazil
2.4.2 Other South America
2.5 Asia-Pacific
2.5.1 China
2.5.2 India
2.5.3 Japan
2.5.4 South Korea
2.5.5 Other Asia-Pacific
3 Company Profiles
3.1 Western Europe
Belgium (2 Producers)
Finland (1)
France (3)
Germany (3)
Italy (1)
Norway (1)
Spain (1)
Switzerland (1)
The Netherlands (2)
United Kingdom (2)
3.2 Eastern Europe
Hungary (1)
Poland (1)
Russia (3)
3.3 North America
Canada (1)
Mexico (1)
USA (17)
3.4 South America
Brazil (2)
3.5 Asia-Pacific
China (4)
India (6)
Indonesia (1)
Japan (10)
Malaysia (1)
South Korea (8)
Taiwan (2)
Thailand (2)
3.6 Middle East
Qatar (1)
Saudi Arabia (1)
3.7 Africa
South Africa (1)
*Note: The profiles are assigned to the country in which the company or holding is headquartered. Profiles also include JVs and subsidiaries.
Graph 1: Global demand from 2021 to 2033
Graph 2: Global demand from 2021 to 2033 – split by region
Graph 3: Global revenues from 2021 to 2033 in billion USD and billion EUR
Graph 4: Global revenues from 2021 to 2033 in billion USD – split by region
Graph 5: Global revenues from 2021 to 2033 in billion EUR – split by region
Graph 6: Global demand from 2021 to 2033 – split by application
Graph 7: Global demand in the “paints & coatings” segment from 2021 to 2033 – split by region
Graph 8: Global demand in the “printing inks” segment from 2021 to 2033 – split by region
Graph 9: Global demand in the “adhesives” segment from 2021 to 2033 – split by region
Graph 10: Global demand in the “cosmetics & personal care” segment from 2021 to 2033 – split by region
Graph 11: Global demand in the “pharmaceuticals” segment from 2021 to 2033 – split by region
Graph 12: Global demand in the “other applications” segment from 2021 to 2033 – split by region
Graph 13: Demand in Western Europe from 2021 to 2033
Graph 14: Revenues generated in Western Europe from 2021 to 2033 in billion USD and billion EUR
Graph 15: Demand in Western Europe from 2021 to 2033 – split by application
Graph 16: Demand in Eastern Europe from 2021 to 2033
Graph 17: Revenues generated in Eastern Europe from 2021 to 2033, in billion USD and billion EUR
Graph 18: Demand in Eastern Europe from 2021 to 2033 – split by application
Graph 19: Demand in North America from 2021 to 2033
Graph 20: Revenues generated in North America from 2021 to 2033, in billion USD and billion EUR
Graph 21: Demand in North America from 2021 to 2033 – split by application
Graph 22: Demand in South America from 2021 to 2033
Graph 23: Revenues generated in South America from 2021 to 2033, in billion USD and billion EUR
Graph 24: Demand in South America from 2021 to 2033 – split by application
Graph 25: Demand in Asia-Pacific from 2021 to 2033
Graph 26: Revenues generated in Asia-Pacific from 2021 to 2033, in billion USD and billion EUR
Graph 27: Demand in Asia-Pacific from 2021 to 2033 – split by application
Graph 28: Demand in the Middle East from 2021 to 2033
Graph 29: Revenues generated in the Middle East from 2021 to 2033, in billion USD and billion EUR
Graph 30: Demand in the Middle East from 2021 to 2033 – split by application
Graph 31: Demand in Africa from 2021 to 2033
Graph 32: Revenues generated in Africa from 2021 to 2033, in billion USD and billion EUR
Graph 33: Demand in Africa from 2021 to 2033 – split by application
Graph 34: Demand in France from 2021 to 2033
Graph 35: Demand in Germany from 2021 to 2033
Graph 36: Demand in Italy from 2021 to 2033
Graph 37: Demand in Spain from 2021 to 2033
Graph 38: Demand in the United Kingdom from 2021 to 2033
Graph 39: Demand in Other Western Europe from 2021 to 2033
Graph 40: Demand in Poland from 2021 to 2033
Graph 41: Demand in Russia from 2021 to 2033
Graph 42: Demand in Türkiye from 2021 to 2033
Graph 43: Demand in Other Eastern Europe from 2021 to 2033
Graph 44: Demand in Canada from 2021 to 2033
Graph 45: Demand in Mexico from 2021 to 2033
Graph 46: Demand in the USA from 2021 to 2033
Graph 47: Demand in Brazil from 2021 to 2033
Graph 48: Demand in Other South America from 2021 to 2033
Graph 49: Demand in China from 2021 to 2033
Graph 50: Demand in India from 2021 to 2033
Graph 51: Demand in Japan from 2021 to 2033
Graph 52: Demand in South Korea from 2021 to 2033
Graph 53: Demand in Other Asia-Pacific from 2021 to 2033
Table 1: Global demand from 2021 to 2033 – split by region
Table 2: Global revenues from 2021 to 2033 in million USD – split by region
Table 3: Global revenues from 2021 to 2033 in million EUR – split by region
Table 4: Global demand from 2021 to 2033 – split by application
Table 5: Global demand in the “paints & coatings” segment from 2021 to 2033 – split by region
Table 6: Global demand in the “printing inks” segment from 2021 to 2033 – split by region
Table 7: Global demand in the “adhesives” segment from 2021 to 2033 – split by region
Table 8: Global demand in the “cosmetics & personal care” segment from 2021 to 2033 – split by region
Table 9: Global demand in the “pharmaceuticals” segment from 2021 to 2033 – split by region
Table 10: Global demand in the “other applications” segment from 2021 to 2033 – split by region
Table 11: Global revenues from 2021 to 2033 – split by application
Table 12: Global revenues generated in the “paints & coatings” segment from 2021 to 2033 – split by region
Table 13: Global revenues generated in the “printing inks” segment from 2021 to 2033 – split by region
Table 14: Global revenues generated in the “adhesives” segment from 2021 to 2033 – split by region
Table 15: Global revenues generated in the “cosmetics & personal care” segment from 2021 to 2033 – split by region
Table 16: Global revenues generated in the “pharmaceuticals” segment from 2021 to 2033 – split by region
Table 17: Global revenues generated in the “other applications” segment from 2021 to 2033 – split by region
Table 18: Global demand from 2021 to 2033 – split by product
Table 19: Global demand for the product “alcohols: ethanol” from 2021 to 2033 – split by region
Table 20: Global demand for the product “alcohols: n-butanol” from 2021 to 2033 – split by region
Table 21: Global demand for the product “alcohols: isopropanol” from 2021 to 2033 – split by region
Table 22: Global demand for the product “alcohols: methanol” from 2021 to 2033 – split by region
Table 23: Global demand for the product “alcohols: others” from 2021 to 2033 – split by region
Table 24: Global demand for the product “ketones: acetone” from 2021 to 2033 – split by region
Table 25: Global demand for the product “ketones: MEK” from 2021 to 2033 – split by region
Table 26: Global demand for the product “ketones: others” from 2021 to 2033 – split by region
Table 27: Global demand for the product “esters” from 2021 to 2033 – split by region
Table 28: Global demand for the product “ethers” from 2021 to 2033 – split by region
Table 29: Global demand for the product “aromatics: toluene” from 2021 to 2033 – split by region
Table 30: Global demand for the product “aromatics: others” from 2021 to 2033 – split by region
Table 31: Global demand for the product “non-aromatics” from 2021 to 2033 – split by region
Table 32: Global demand for the product “other solvents” from 2021 to 2033 – split by region
Table 33: Demand in Western Europe from 2021 to 2033 – split by major country
Table 34: Revenues generated in Western Europe from 2021 to 2033, in million USD and million EUR
Table 35: Revenues generated in Western Europe from 2021 to 2033 – split by application
Table 36: Demand in Western Europe from 2021 to 2033 – split by application
Table 37: Demand in Western Europe from 2021 to 2033 – split by product
Table 38: Demand in Eastern Europe from 2021 to 2033 – split by major country
Table 39: Revenues generated in Eastern Europe from 2021 to 2033, in million USD and million EUR
Table 40: Revenues generated in Eastern Europe from 2021 to 2033 – split by application
Table 41: Demand in Eastern Europe from 2021 to 2033 – split by application
Table 42: Demand in Eastern Europe from 2021 to 2033 – split by product
Table 43: Demand in North America from 2021 to 2033 – split by major country
Table 44: Revenues generated in North America from 2021 to 2033, in million USD and million EUR
Table 45: Demand in North America from 2021 to 2033 – split by application
Table 46: Demand in North America from 2021 to 2033 – split by application
Table 47: Demand in North America from 2021 to 2033 – split by product
Table 48: Demand in South America from 2021 to 2033 – split by major country
Table 49: Revenues generated in South America from 2021 to 2033, in million USD and million EUR
Table 50: Revenues generated in South America from 2021 to 2033 – split by application
Table 51: Demand in South America from 2021 to 2033 – split by application
Table 52: Demand in South America from 2021 to 2033 – split by product
Table 53: Demand in Asia-Pacific from 2021 to 2033 – split by major country
Table 54: Revenues generated in Asia-Pacific from 2021 to 2033, in million USD and million EUR
Table 55: Revenues generated in Asia-Pacific from 2021 to 2033 – split by application
Table 56: Demand in Asia-Pacific from 2021 to 2033 – split by application
Table 57: Demand in Asia-Pacific from 2021 to 2033 – split by product
Table 58: Revenues generated in the Middle East from 2021 to 2033, in million USD and million EUR
Table 59: Revenues generated in the Middle East from 2021 to 2033 – split by application
Table 60: Demand in the Middle East from 2021 to 2033 – split by application
Table 61: Demand in the Middle East from 2021 to 2033 – split by product
Table 62: Revenues generated in Africa from 2021 to 2033, in million USD and million EUR
Table 63: Revenues generated in Africa from 2021 to 2033 – split by application
Table 64: Demand in Africa from 2021 to 2033 – split by application
Table 65: Demand in Africa from 2021 to 2033 – split by product
Table 66: Revenues generated in France from 2021 to 2033, in million USD and million EUR
Table 67: Revenues generated in France from 2021 to 2033 – split by application
Table 68: Demand in France from 2021 to 2033 – split by application
Table 69: Demand in France from 2021 to 2033 – split by product
Table 70: Revenues generated in Germany from 2021 to 2033, in million USD and million EUR
Table 71: Revenues generated in Germany from 2021 to 2033 – split by application
Table 72: Demand in Germany from 2021 to 2033 – split by application
Table 73: Demand in Germany from 2021 to 2033 – split by product
Table 74: Revenues generated in Italy from 2021 to 2033, in million USD and million EUR
Table 75: Revenues generated in Italy from 2021 to 2033 – split by application
Table 76: Demand in Italy from 2021 to 2033 – split by application
Table 77: Demand in Italy from 2021 to 2033 – split by product
Table 78: Revenues generated in Spain from 2021 to 2033, in million USD and million EUR
Table 79: Revenues generated in Spain from 2021 to 2033 – split by application
Table 80: Demand in Spain from 2021 to 2033 – split by application
Table 81: Demand in Spain from 2021 to 2033 – split by product
Table 82: Revenues generated in the United Kingdom from 2021 to 2033, in million USD and million EUR
Table 83: Revenues generated in the United Kingdom from 2021 to 2033 – split by application
Table 84: Demand in the United Kingdom from 2021 to 2033 – split by application
Table 85: Demand in the United Kingdom from 2021 to 2033 – split by product
Table 86: Revenues generated in Other Western Europe from 2021 to 2033, in million USD and million EUR
Table 87: Revenues generated in Other Western Europe from 2021 to 2033 – split by application
Table 88: Demand in Other Western Europe from 2021 to 2033 – split by application
Table 89: Demand in Other Western Europe from 2021 to 2033 – split by product
Table 90: Revenues generated in Poland from 2021 to 2033, in million USD and million EUR
Table 91: Revenues generated in Poland from 2021 to 2033 – split by application
Table 92: Demand in Poland from 2021 to 2033 – split by application
Table 93: Demand in Poland from 2021 to 2033 – split by product
Table 94: Revenues generated in Russia from 2021 to 2033, in million USD and million EUR
Table 95: Revenues generated in Russia from 2021 to 2033 – split by application
Table 96: Demand in Russia from 2021 to 2033 – split by application
Table 97: Demand in Russia from 2021 to 2033 – split by product
Table 98: Revenues generated in Türkiye from 2021 to 2033, in million USD and million EUR
Table 99: Revenues generated in Türkiye from 2021 to 2033 – split by application
Table 100: Demand in Türkiye from 2021 to 2033 – split by application
Table 101: Demand in Türkiye from 2021 to 2033 – split by product
Table 102: Revenues generated in Other Eastern Europe from 2021 to 2033, in million USD and million EUR
Table 103: Revenues generated in Other Eastern Europe from 2021 to 2033 – split by application
Table 104: Demand in Other Eastern Europe from 2021 to 2033 – split by application
Table 105: Demand in Other Eastern Europe from 2021 to 2033 – split by product
Table 106: Revenues generated in Canada from 2021 to 2033, in million USD and million EUR
Table 107: Revenues generated in Canada from 2021 to 2033 – split by application
Table 108: Demand in Canada from 2021 to 2033 – split by application
Table 109: Demand in Canada from 2021 to 2033 – split by product
Table 110: Revenues generated in Mexico from 2021 to 2033, in million USD and million EUR
Table 111: Revenues generated in Mexico from 2021 to 2033 – split by application
Table 112: Demand in Mexico from 2021 to 2033 – split by application
Table 113: Demand in Mexico from 2021 to 2033 — split by product
Table 114: Revenues generated in the USA from 2021 to 2033, in million USD and million EUR
Table 115: Revenues generated in the USA from 2021 to 2033 – split by application
Table 116: Demand in the USA from 2021 to 2033 – split by application
Table 117: Demand in the USA from 2021 to 2033 – split by product
Table 118: Revenues generated in Brazil from 2021 to 2033, in million USD and million EUR
Table 119: Revenues generated in Brazil from 2021 to 2033 – split by application
Table 120: Demand in Brazil from 2021 to 2033 – split by application
Table 121: Demand in Brazil from 2021 to 2033 – split by product
Table 122: Revenues generated in Other South America from 2021 to 2033, in million USD and million EUR
Table 123: Revenues generated in Other South America from 2021 to 2033 – split by application
Table 124: Demand in Other South America from 2021 to 2033 – split by application
Table 125: Demand in Other South America from 2021 to 2033 – split by product
Table 126: Revenues generated in China from 2021 to 2033, in million USD and million EUR
Table 127: Revenues generated in China from 2021 to 2033 – split by application
Table 128: Demand in China from 2021 to 2033 – split by application
Table 129: Demand in China from 2021 to 2033 – split by product
Table 130: Revenues generated in India from 2021 to 2033, in million USD and million EUR
Table 131: Revenues generated in India from 2021 to 2033 – split by application
Table 132: Demand in India from 2021 to 2033 – split by application
Table 133: Demand in India from 2021 to 2033 — split by product
Table 134: Revenues generated in Japan from 2021 to 2033, in million USD and million EUR
Table 135: Revenues generated in Japan from 2021 to 2033 – split by application
Table 136: Demand in Japan from 2021 to 2033 – split by application
Table 137: Demand in Japan from 2021 to 2033 – split by product
Table 138: Revenues generated in South Korea from 2021 to 2033, in million USD and million EUR
Table 139: Revenues generated in South Korea from 2021 to 2033 – split by application
Table 140: Demand in South Korea from 2021 to 2033 – split by application
Table 141: Demand in South Korea from 2021 to 2033 – split by product
Table 142: Revenues generated in Other Asia-Pacific from 2021 to 2033, in million USD and million EUR
Table 143: Revenues generated in Other Asia-Pacific from 2021 to 2033 – split by application
Table 144: Demand in Other Asia-Pacific from 2021 to 2033 – split by application
Table 145: Demand in the remaining countries of Asia-Pacific from 2021 to 2033 – split by product


